Looking For Acceleration In All The Wrong Places
By Willis Eschenbach | Watts Up With That? | March 8, 2020
After considering the tide gauge records around Fairbourne in my last post, I wanted to look at a larger picture. Remember that we’ve been repeatedly told that acceleration in sea level rise is not just forecast, it’s actually occurring. I wrote about some of these claims in my post entitled “Accelerating The Acceleration“. Plus we’ve been deluged, if you’ll excuse the word, with endless cartoons and memes and movies and earnest predictions about the Statue of Liberty going underwater, cities being drowned, islands being overtopped by the sea, and the like. And not only that, but we’re assured that we can see and measure the acceleration in both the tide gauge and the satellite sea-level records.
So I went to get the satellite sea-level records from the University of Colorado. But when I plotted them up, I realized that they stopped in 1918. I couldn’t find anything on their website that explained why. Here’s their data.

Figure 1. University of Colorado sea-level record. Note that it is a splice of four satellite datasets that all seem to be in quite good agreement.
I wanted more up-to-date records, so I went to the AVISO site. That’s the French group that is keeping the original satellite records.
I did have to laugh, though, when I looked around the AVISO site and found the following graph:

Figure 2. All nine available satellite sea-level records
YIKES! I truly had no idea that it was all this bad. It seems the good folks in Colorado have simply picked some convenient records from the group above, spliced them together, and called it a valid record fit for all purposes.
I, on the other hand, would say that this is enough data to maybe give us a trend with lots of uncertainty … but teasing acceleration out of that farrago? Don’t make me laugh.
However, I figured I’d look at the AVISO “Reference” dataset. This is the dataset shown in green above. It is basically identical to the Colorado dataset, but it extends to the end of 2019. So I analyzed it.
Now, I’ve recently started to use a sea-level analysis method I developed myself. It’s based on a lovely kind of analysis called “Complete Ensemble Empirical Mode Decomposition” (CEEMD). I described CEEMD in a 2015 post called “Noise Assisted Data Analysis“.
What the CEEMD method does is to identify and remove, one by one, the underlying cycles in the dataset under analysis. And at the end of the CEEMD analysis what’s left is called the “Residual”. It’s what remains when all identifiable cycles have been removed.
Of course, the method can’t identify the cycles that are nearly as long as the dataset itself or longer. So for example, from my last analysis, I looked at 40 to 50 year long datasets. Here’s an example, this one is 44 years long.

Figure 3. A CEEMD analysis of the tidal data from Fishguard, Wales.
As you can see, this has not removed a cycle that’s on the order of 33 years long—too long to resolve in a 44-year dataset.
And this demonstrates a huge problem with trying to determine if the rate of sea level rise is accelerating. It’s well known that the tides have very long-term cycles of fifty years and more. But as I pointed out in my post called “Accelerating The Acceleration“, the people who produced the “US Sea Level Report Card” cut the tidal data short. They removed everything before 1969 … which guarantees that the signal will still contain cycles. And that, in turn, guarantees that any conclusions that they come to will be meaningless.
The other problem is that in the “US Sea Level Report Card”, they don’t even attempt to remove the tidal cycles at all. They foolishly think that you just need to check and see if the raw data is accelerating … but instead, they end up simply measuring some long-term tidal cycle or other.
With that as prologue, I decided to look at the longest sea-level records and see if there is any acceleration. We have a few of these that have 100 to 150+ years of data. This is long enough to remove most of the long-term tidal cycles. As above, I used the CEEMD method to remove the cycles, leaving just the underlying residual. To start with, I looked at the sea-level data for Cuxhaven in Germany. It’s a 176-year dataset.
So just what longer-term sea-level cycles are being removed by the CEEMD method? Here are the empirically-determined groups of cycles that make up the Cuxhaven sea level data:

Figure 4. Periodograms of the groups of cycles removed from the Cuxhaven sea level data by the CEEMD method.
As you might expect, there are a number of short-term cycles between one and five years. There is also energy in cycles that peak at eight, seventeen, and twenty-four years or so. Note that one of the largest cycles is up near fifty years … highlighting the foolishness of a) not removing the persistent long-period tidal cycles, and b) using short-length datasets to try to determine if there is acceleration.
Finally, note that there is still some energy in cycles longer than fifty years. This is why we need very long datasets in order to determine if there is acceleration.
So what’s left as a residual once we remove all of those cycles from the Cuxhaven data? Here’s the result:

Figure 5. CEEMD analysis of the sea level data from Cuxhaven, Germany. Black/white line is the original Cuxhaven data.
As you can see, there is no sign of acceleration in the Cuxhaven sea level data. Remember that we’ve been warned for the last thirty years that sea level would be accelerating and cities would be drowning … but it appears that the ocean didn’t get the memo.
Let me demonstrate how badly folks are going wrong by using shorter-term data and not removing the underlying tidal cycles from the original data. Here’s the previous graph, plus a Gaussian smooth in blue of the post-1950 original data.

Figure 6. As in Figure 5, but with a 19-year FWHM centered Gaussian smooth of the post-1950 original data.
Now, if all that we had was the 68 years of the post-1950 data, and in addition, we didn’t remove any underlying cycles, we’d look at the blue gaussian smooth and come away firmly convinced that the sea level was running level from 1950 to about 1975, and that it had accelerated since then … none of which is true. That’s just one of the underlying longer-term tidal swings that are removed by the CEEMD method. And unfortunately, scientists around the planet are all too frequently mistaking those tidal swings for an underlying acceleration.
Unwilling to stop there, I looked at a number of the few other long-term sea level datasets we have. As you might expect, most of them are from Europe. Here’s a 170-year dataset from Wismar in Germany.

Figure 7. CEEMD residual analysis. Black/white line is the actual data.
Again, there’s no sign at all of any acceleration in the Wismar data.
And below, without much in the way of comments, are a number of the other long-term sea-level datasets. In all cases, the black/white line with dots is the original data.


I don’t see the rumored acceleration in those plots. I’d also say that the early data from IJmudgen is very suspect … next, some data from the US.


Note the larger trend in Baltimore, which is known to be the result of land subsidence along most of the US east coast.

And to close out this section, here’s the longest uninterrupted sea-level dataset I know of, that of Stockholm in Sweden, two hundred and seventeen years long …

You can see how the earth in Sweden is still rebounding from being covered with trillions of tons of ice during the most recent glaciation. The land is actually rising faster than the ocean … go figure.
So those are the majority of the long tidal datasets. I gotta say, I am simply not seeing the acceleration claimed by the boffins. I don’t know just how they’ve calculated their results, but the best long-term datasets that we have simply don’t show the acceleration that they claim to find.
In closing, let me circle back to where I started, with the spliced AVISO satellite sea level data. Here’s what the AVISO and the Colorado folks are combining to get their final data:

Figure 8. The four satellite sea-level records chosen by Colorado and Aviso from the nine extant satellite sea-level records.
I gotta say … given that the satellite sea level is supposed to be accurate to tenths of a millimetre per year, why are there such large differences between the different satellite records?
In any case, here is the same data, with a black line showing their final dataset created by combining those four datasets.

Figure 9. The four satellite sea-level records chosen by Colorado and Aviso from the nine extant satellite sea-level records, along with their combined record which is shown in black.
Hmmm … and finally, here is the CEEMD analysis of that combined record.

Figure 10. CEEMD analysis of the AVISO / Colorado satellite dataset. It is composed of four different satellite datasets spliced together. Midpoints of the splices are shown by the vertical red dotted lines.
Now, is there acceleration in that record?
Well … regarding the question of whether there is acceleration shown in that spliced satellite record, I’ll say the three most important words that any scientist can ever say:
We. Don’t. Know.
We don’t know for a few reasons. The first is that it’s a spliced dataset, and the changes in the trend line all occur at and after the splices. Makes a man suspicious, particularly given the differences in the initial individual datasets.
The second is that the record is only 27 years long, so we really don’t have enough data to draw many conclusions. This is particularly true since the variations from a straight line are quite small.
Third, the rise was right along the linear trend line up until 2005. So there was no acceleration before that time. Then the rate of rise started decreasing around 2005 … deceleration rather than acceleration? Why? And then, according to the spliced dataset, it started rising faster around 2011. Again, why? Assuredly those three, first a straight line, then deceleration, then acceleration, are unlikely to be caused by a monotonic rise in CO2. Nor do they conform with any expected pattern of acceleration.
Finally, as with many other tidal records shown above, the satellite seems to be “porpoising” above and below the trend line. There’s no clear acceleration anywhere in the record.
DISCUSSION AND CONCLUSIONS
The long-term tide gauge datasets are all in agreement that there is no acceleration, neither in the early nor in the recent parts of the records. Yes, they often porpoise a bit above and a bit below the trend line, but there is no evidence of any CO2-caused recent increase in the rate of sea-level rise.
The satellite dataset, on the other hand, is a splice of a selected four of the nine available satellite sea-level datasets. The changes in trend seem to be associated with the splices. Unfortunately, this spliced record is both too short and too fractured to draw any conclusions about acceleration.
Satellite sea level data has been “adjusted” upward by 34% over past 9 years alone
THE HOCKEY SCHTICK |October 30, 2013
There are many documented examples of sea level data from satellite altimeters being “adjusted” upward many years after publication, often repeatedly on the same data, and in defiance of the laws of probability, always in an upward direction. Seven documented examples can be found in the links in this post. A recent comment in a sea level article on the Yale Environment 360 site documents another example of sea level data being adjusted upward by 34% [by 1 mm/yr, equivalent to an additional 4 inches per century] over the 9 years since it was collected and published on the University of Colorado website.
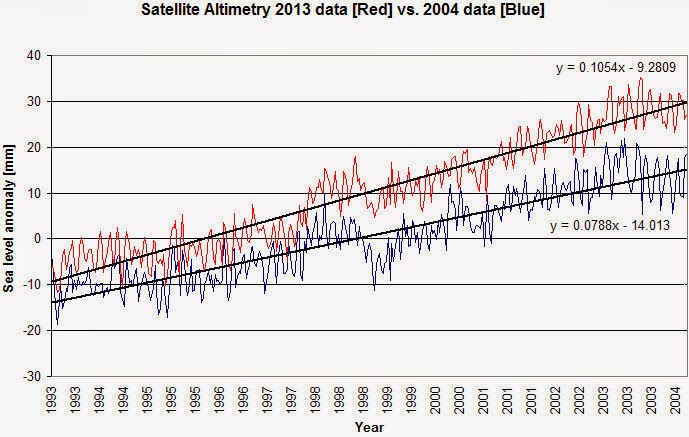 |
| Data published on U of Colorado website in 2004 shown in blue. Same data after 9 years of adjustments published on same website today shown in red. The slope of the same 1992-2004 data has somehow increased by 34% over the past 9 years. |
H/T: Based upon the comment by Steve Case in this article:
Here’s an interesting presentation by Dr. R. Steve Nerem, who is well quoted in the article:
“Why has an acceleration of sea level rise not been observed during the altimeter era?” R. Steven Nerem (University of Colorado)
One has to wonder what all the excitement is about if for the last twenty years there has been no acceleration of the rate. Couple that with the fact that it’s rather easy to determine that there’s been a good deal of inflating the rate of sea level rise by those same CU Sea Level Research Group scientists.
Simply put the URL of their home page (http://sealevel.colorado.edu/) into the Internet WayBack Machine (https://archive.org/) and see for yourself.
This archived time line:
(https://web.archive.org/web/20040719102733/http://sealevel.colorado.edu/2004_rel1.2/sl_ib_ns_cu2004_rel1.2_global.txt) differs from the current one: (http://sealevel.colorado.edu/files/2013_rel7/sl_ns_global.txt) in a rather interesting fashion. Changes have been made to the data resulting in an increase in the rate of reported sea level rise by nearly a millimeter per year.
Also see my comments on the same article:
Sea levels have been rising naturally for the past 20,000 years and at much, much faster rates in the past (up to 40 times faster than today). http://www.globalwarmingart.com/wiki/File:Post-Glacial_Sea_Level_png
Sea levels are currently rising 4 to 8 inches per century, and there is no acceleration, which means there is no evidence of a human influence on sea levels: http://hockeyschtick.blogspot.com/2013/09/new-paper-finds-sea-levels-rising-at.html
References finding no acceleration:
JM Gregory et al Journal of Climate 2012, M Beenstock et al 2013, NOAA 2005-2012 Sea Level Budget, Dean & Houston 2011 & 2013, Scafetta 2013, Holgate 2007, Boretti 2012, Morner 2004, Jevrejeva et al., 2006 & 2008, Wöppelmann et al., 2009
“no long-term acceleration of sea level has been identified using 20th-century data alone.”
“It is likely that GMSL (Global Mean Sea Level) rose between 1920 and 1950 at a rate comparable to that observed between 1993 and 2010”
… the authors find that sea level rise is a localized rather than global phenomenon, with 61 percent of tide gauge records demonstrating no change in sea levels, 4 percent showing a decrease, and a minority of 35 percent showing a rise. This implies relative sea level change is primarily related to subsidence or post-glacial rebound (land height changes) rather than melting ice or steric sea level changes (thermal expansion from warming). http://hockeyschtick.blogspot.com/2013/09/new-paper-finds-sea-levels-rising-at.html
Featured Video

No Threat Can Force Iran’s Surrender /Trita Parsi & Lt Cl Daniel Davis
or go to
Aletho News Archives – Video-Images
From the Archives
An Expert Military Analysis of War with China
Actually, None is Necessary
By Fred Reed • Unz Review • December 13, 2020
The Correlation of Armed Forces: U.S. goods and services trade with China totaled an estimated $634.8 billion in 2019. Exports were $163.0 billion; imports were $471.8 billion. The U.S. goods and services trade deficit with China was $308.8 billion in 2019. Trade in services with China (exports and imports) totaled an estimated $76.7 billion in 2019. Services exports were $56.5 billion; services imports were $20.1 billion. The U.S. services trade surplus with China was $36.4 billion in 2019.
There is talk within the Washingtoniat of a possible war with China. Steve Bannon, who apparently was dropped on his head as a child, actually favors such a war. We hear the usual shoo-the-boobs alarm about how the Chinese are doing something terrible and we must gird our loins and American values and show them what for, bow wow, woof. The danger is that the current game of who-blinks-first in Asian waters might actually provoke a shooting war. You know the kind of thing: One warship refuses to get out of the way of another, a collision ensues, some retard lieutenant who signed up on waivers opens fire, and we’re off and running. It is not a good idea to let children play with matches.
The said war is discussed either in emotional terms by idiots or in purely naval terms by those familiar with such things, so we hear of the First Island Chain and the Second Island Chain and whose missiles against the other’s missiles and so on. This would be appropriate if we were fighting World War Two again. Which we aren’t. Let’s take a quick-and-dirty look at how such a war might go.
To begin the war, America would overestimate itself and underestimate China. This is doctrine in the Pentagon. … continue
Blog Roll
 Aletho News
- Theodore Postol: Iran’s Missiles & Drones Were Underestimated
- Iran To Target Military Industrial-Tech Complex That Facilitated Gaza Genocide
- Collapsing Empire: The Resistance Disarms ‘Israel’
- Suicide Should Not Be a Government Service
- Rethinking America’s greatest threat: Iran vs. Israel-Firsters
- Iran accuses adversaries of false flags to strain Turkey ties
- Poland rules out sending Patriot missiles to US/Israel amid war on Iran
- Tehran approves new Hormuz plan with major restrictions
- No Threat Can Force Iran’s Surrender /Trita Parsi & Lt Cl Daniel Davis
- UK’s New Pandemic Plan Would Turn Big Tech Into a Mass Location Tracking Network
- If Americans Knew
- Ann Coulter Rips Into Fox News for Iran War Coverage, Compares to False Rigged 2020 Election Reporting
- Joe Kent Urges Americans To Call White House and Congress To Object To Sending Troops Into Iran
- DNC Resolution to Reject AIPAC Funding Puts Democratic Leaders in the Hot Seat
- Swedish foundation to build 400 schools as over 650,000 Gaza children remain without education for 2 years
- Israeli army admits photshopping image of slain Lebanese journalist
- This is how Israel is systematically killing health workers under the cover of war in Lebanon
- Carrying life under fire: Israeli invasion of Lebanon leaves pregnant women facing deadly risks
- Champagne all around for the new death penalty (for Palestinians) law – Not a ceasefire Day 172
- Why are Palestinian books struggling to be seen on Amazon?
- The Line Between Affinity and Conspiracy
- No Tricks Zone
- New Study Finds Warming Saves Lives…Cold Temperatures 12 Times More Deadly Than Excess Heat
- German Science Blog Accuses PIK Climate Institute Of Hallucinating Climate Tipping Points
- Devastating Assessment Of Comirnaty Vaccine By Former Senior Pfizer Europe Toxicologist
- New Study: CO2 Is ‘Effectively Negligible’ As An Explanatory Climate Change Factor Since 2000
- Former Pfizer Toxicologist Dr. Helmut Sterz Tells Bundestag Hearing Pfizer Vaccine Should Have Never Been Approved
- Energy Expert: Germany’s Nuclear Phaseout Was A “500 Billion Euro Mistake”
- New Research: South Australia’s Mid-Holocene Sea Surface Temperatures Were 4°C Warmer Than Today
- Storing Green Energy To Last Germany 10 Days Would Require A 60-Million Tonne Battery
- New Studies: UK Sea Levels Were 4 Meters Higher Than Today During The Mid-Holocene
- Destructive Green New Deal: German Energy And Metal Group Warns Of Drastic Crisis
