NOAA’s Tornado Fraud
By Paul Homewood | Not A Lot Of People Know That | January 15, 2017
https://www.ncdc.noaa.gov/sotc/tornadoes/201613
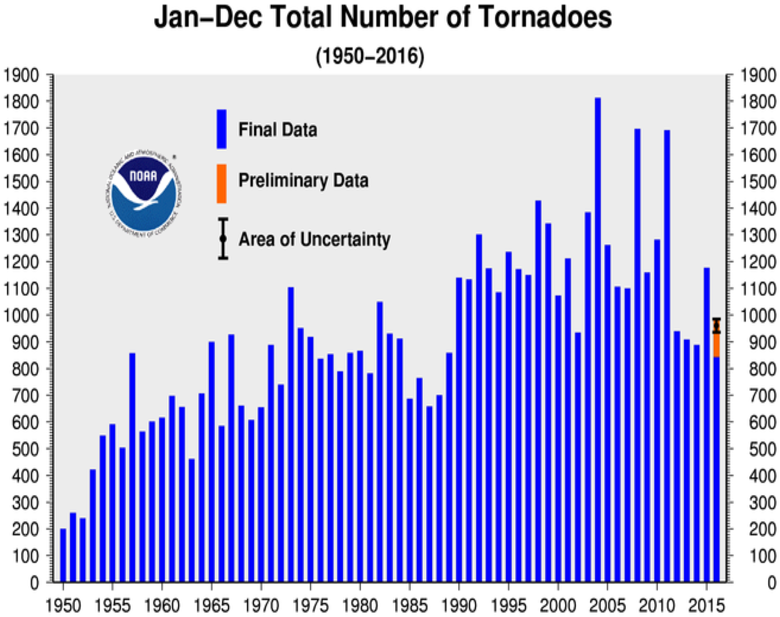
According to NOAA, the number of tornadoes has been steadily growing since the 1950s, despite a drop in numbers in the last five years.
They show the above chart prominently in their Tornadoes – Annual 2016 Report.
However, they know full well that it is meaningless to compare current data with the past, as they explain themselves in the section Historical Records and Trends, which is hidden away on their own website:
One of the main difficulties with tornado records is that a tornado, or evidence of a tornado must have been observed. Unlike rainfall or temperature, which may be measured by a fixed instrument, tornadoes are short-lived and very unpredictable. If a tornado occurs in a place with few or no people, it is not likely to be documented. Many significant tornadoes may not make it into the historical record since Tornado Alley was very sparsely populated during the 20th century.
Much early work on tornado climatology in the United States was done by John Park Finley in his book Tornadoes, published in 1887. While some of Finley’s safety guidelines have since been refuted as dangerous practices, the book remains a seminal work in tornado research. The University of Oklahoma created a PDF copy of the book and made it accessible at John Finley’s Tornadoes (link is external).
Today, nearly all of the United States is reasonably well populated, or at least covered by NOAA’s Doppler weather radars. Even if a tornado is not actually observed, modern damage assessments by National Weather Service personnel can discern if a tornado caused the damage, and if so, how strong the tornado may have been. This disparity between tornado records of the past and current records contributes a great deal of uncertainty regarding questions about the long-term behavior or patterns of tornado occurrence. Improved tornado observation practices have led to an increase in the number of reported weaker tornadoes, and in recent years EF-0 tornadoes have become more prevelant in the total number of reported tornadoes. In addition, even today many smaller tornadoes still may go undocumented in places with low populations or inconsistent communication facilities.
With increased National Doppler radar coverage, increasing population, and greater attention to tornado reporting, there has been an increase in the number of tornado reports over the past several decades. This can create a misleading appearance of an increasing trend in tornado frequency. To better understand the variability and trend in tornado frequency in the United States, the total number of EF-1 and stronger, as well as strong to violent tornadoes (EF-3 to EF-5 category on the Enhanced Fujita scale) can be analyzed. These tornadoes would have likely been reported even during the decades before Doppler radar use became widespread and practices resulted in increasing tornado reports. The bar charts below indicate there has been little trend in the frequency of the stronger tornadoes over the past 55 years.


https://www.ncdc.noaa.gov/climate-information/extreme-events/us-tornado-climatology/trends
Of course it is nonsensical to claim that the bar charts below indicate there has been little trend in the frequency of the stronger tornadoes over the past 55 years – there has clearly been a large reduction.
Note as well that they have not even bothered to update the graph for 2015. Could it be they would rather the public did not find out the truth?
Meanwhile, over at the Storm Prediction Center (SPC) you can see that, when allowance is made for changing reporting procedures, last year may well have had the lowest number of tornadoes on record.

http://www.spc.noaa.gov/wcm/#data
The SPC is also part of NOAA, but is the department that actually deals with tornado events and data on a day to day basis. As such, they tend to be more interested in the facts, rather than a political agenda.
While we still await the final numbers and classification for last year, but what we do know is that there was no EF-5. Indeed the last occurrence was the Moore, OK tornado in May 2013.
It is unusual to go nearly four years without one, as there have been 59 since 1953, effectively one a year on average.
The bottom line is that the NOAA headline graph is grossly dishonest. Indeed, if a company published something like that in their Annual Accounts, they would probably end up in jail!
NOAA themselves know all of this full well.
Which raises the question – why are they perpetuating this fraud?
100% Of US Warming Is Due To NOAA Data Tampering
By Tony Heller | The Deplorable Climate Science Blog | December 28, 2016
Climate Central just ran this piece, which the Washington Post picked up on. They claimed the US was “overwhelmingly hot” in 2016, and temperatures have risen 1,5°F since the 19th century.
The U.S. Has Been Overwhelmingly Hot This Year | Climate Central
The first problem with their analysis is that the US had very little hot weather in 2016. The percentage of hot days was below average, and ranked 80th since 1895. Only 4.4% of days were over 95°F, compared with the long term average of 4.9%. Climate Central is conflating mild temperatures with hot ones.
They also claim US temperatures rose 1.5°F since the 19th century, which is what NOAA shows.
Climate at a Glance | National Centers for Environmental Information (NCEI)
The problem with the NOAA graph is that it is fake data. NOAA creates the warming trend by altering the data. The NOAA raw data shows no warming over the past century
The adjustments being made are almost exactly 1.5°F, which is the claimed warming in the article.
The adjustments correlate almost perfectly with atmospheric CO2. NOAA is adjusting the data to match global warming theory. This is known as PBEM (Policy Based Evidence Making.)
The hockey stick of adjustments since 1970 is due almost entirely to NOAA fabricating missing station data. In 2016, more than 42% of their monthly station data was missing, so they simply made it up. This is easy to identify because they mark fabricated temperatures with an “E” in their database.
When presented with my claims of fraud, NOAA typically tries to arm wave it away with these two complaints.
- They use gridded data and I am using un-gridded data.
- They “have to” adjust the data because of Time Of Observation Bias and station moves.
Both claims are easily debunked. The only effect that gridding has is to lower temperatures slightly. The trend of gridded data is almost identical to the trend of un-gridded data.
Time of Observation Bias (TOBS) is a real problem, but is very small. TOBS is based on the idea that if you reset a min/max thermometer too close to the afternoon maximum, you will double count warm temperatures (and vice-versa if thermometer is reset in the morning.) Their claim is that during the hot 1930’s most stations reset their thermometers in the afternoon.
This is easy to test by using only the stations which did not reset their thermometers in the afternoon during the 1930’s. The pattern is almost identical to that of all stations. No warming over the past century. Note that the graph below tends to show too much warming due to morning TOBS.
NOAA’s own documents show that the TOBS adjustment is small (0.3°F) and goes flat after 1990.
https://www.ncdc.noaa.gov/img/climate/research/ushcn/ts.ushcn_anom25_diffs_pg.gif
Gavin Schmidt at NASA explains very clearly why the US temperature record does not need to be adjusted.
You could throw out 50 percent of the station data or more, and you’d get basically the same answers.
One recent innovation is the set up of a climate reference network alongside the current stations so that they can look for potentially serious issues at the large scale – and they haven’t found any yet.
NASA – NASA Climatologist Gavin Schmidt Discusses the Surface Temperature Record
NOAA has always known that the US is not warming.
U.S. Data Since 1895 Fail To Show Warming Trend – NYTimes.com
All of the claims in the Climate Central article are bogus. The US is not warming and 2016 was not a hot year in the US. It was a very mild year.
Senator Markey’s Climate Education Act Goes The Wrong Way
By David Wojick | Climate Etc. | September 5, 2016
The “Climate Change Education Act” (S.3074) directs the National Oceanic and Atmospheric Administration (NOAA) to establish a climate change education program focused on formal and informal learning for all age levels.
When it comes to beating the climate change drum, Sen. Ed Markey is the Energizer Bunny. As a Congressman, Rep. Markey was Chairman of the now defunct House Select Committee on Energy Independence and Global Warming from 2007 to 2011. This time he is drumming on the education front. Markey has dropped the “Climate Education Act” into the Senate hopper. While the bill is unlikely to pass at this time, it is still important to object to, lest it be seen to be acceptable.
Sen. Markey’s website summarizes the proposal as follows: “The “Climate Change Education Act” (S.3074) directs the National Oceanic and Atmospheric Administration (NOAA) to establish a climate change education program focused on formal and informal learning for all age levels. The program would explore solutions to climate change, the dangers we face in a warming world, and relatively small changes in daily routines that can have a profound global impact. The legislation also establishes a grant program to support public outreach programs that improve access to clean energy jobs and research funds so local communities can address climate mitigation and adaptation issues.”
There is a lot not to like here, beginning with the false scientific claims. The first is hyping the supposed dangers we face in a warming world, which simply do not exist. Nor are there small changes in daily routines that can have a profound global impact, because humans do not control the global climate. What is here being called Education is really just scaremongering and propaganda. Ironically, the Bill itself says one goal is to remove the fear of climate change, which it actually promotes.
What is really strange is the focus on so-called clean energy jobs and technology. The term “clean energy” is a misleading euphemism for renewable technologies. Thus the thrust of the Bill is not just on climate science education; rather it is on using the education system to promote renewables. NOAA has no expertise in this regard and no mission. They do things like running the National Weather Service. Promoting renewables and green workforce development is the Energy Department’s job.
On the science side, NOAA has long been active in so-called “climate education,” which basically means spreading the Government’s biased view of climate change as human driven and dangerous. For example, the Climate Literacy and Energy Awareness Network (CLEAN) Portal was launched in 2010, co-sponsored by NOAA, NSF and the Energy Department. As of 2012, CLEAN has been syndicated to NOAA’s climate.gov portal, where they offer over 600 educational materials, most of which are biased toward the scary Federal version of climate science.
In fact NOAA has led a Federal drive to redefine “climate literacy” as accepting the Government’s biased position. According to their website, the stated Guiding Principle for climate literacy is “Humans can take actions to reduce climate change and its impacts.” The reality is that humans can do little to change climate change and a little global warming is not harmful. It is probably beneficial.
What the proposed Climate Education Act would do is give statutory authority for NOAA’s existing propaganda actions, something that is presently lacking. It also allows the agency to bribe states to use its stuff, which is pretty insidious.
It would also allow NOAA to go beyond simply providing online information, to begin writing actual curriculums to be used in the classroom. That is where the bribery really comes in. This curricular push coincides with the widespread deployment of the Next Generation Science Standards. Most states that adopt them need to develop new curriculums, because these science standards are very different from the existing state standards, especially in the area of climate change.
Beyond this, the Bill would put NOAA into the strange new business of promoting the renewable energy industry and training its workers. The Energy Department already does this, while NOAA has neither the mission nor the organization to do it.
In summary this so-called Climate Education Act does nothing that is good, for the climate or the students. It is based on false science and pushes NOAA in the wrong direction. NOAA should be trying to understand climate change, not promote renewable technologies in the name of dangerous global warming.
Press coverage is bad, buying the Bill as expected. See for example these:
Claim: ‘With 2015, Earth Has Back-to-Back Hottest Years Ever Recorded’
MIT Climate Scientist Mocks ‘Hottest Year’ Claim: ‘Anyone who starts crowing about those numbers shows that they’re putting spin on nothing’
Climate Depot | January 20, 2016
NASA and NOAA today proclaimed that 2015 was the ‘hottest year’ on record.
Meanwhile, satellite data shows an 18 plus year standstill in global temperatures.
MIT climate scientist Dr. Richard Lindzen balked at claims of the ‘hottest year’ based on ground based temperature data.
“Frankly, I feel it is proof of dishonesty to argue about things like small fluctuations in temperature or the sign of a trend. Why lend credibility to this dishonesty?” Lindzen, an emeritus Alfred P. Sloan Professor of Meteorology at the Department of Earth, Atmospheric and Planetary Sciences at MIT, told Climate Depot shortly after the announcements.
“All that matters is that for almost 40 years, model projections have almost all exceeded observations. Even if all the observed warming were due to greenhouse emissions, it would still point to low sensitivity,” Lindzen continued.
“But, given the ‘pause.’ we know that natural internal variability has to be of the same order as any other process,” Lindzen wrote.
Lindzen has previously mocked ‘warmest’ or ‘hottest’ year proclamations.
“When someone says this is the warmest temperature on record. What are they talking about? It’s just nonsense. This is a very tiny change period,” Lindzen said in November 2015.
Lindzen cautioned: “The most important thing to keep in mind is – when you ask ‘is it warming, is it cooling’, etc. — is that we are talking about something tiny (temperature changes) and that is the crucial point.”
“And the proof that the uncertainty is tenths of a degree are the adjustments that are being made. If you can adjust temperatures to 2/10ths of a degree, it means it wasn’t certain to 2/10ths of a degree,” he added.
“70% of the earth is oceans, we can’t measure those temperatures very well. They can be off a half a degree, a quarter of a degree. Even two-10ths of a degree of change would be tiny but two-100ths is ludicrous. Anyone who starts crowing about those numbers shows that they’re putting spin on nothing.”
Related:
Hottest Month Claims
By Ken Haapala | Science and Environmental Policy Project (SEPP) | August 29, 2015
Divergence: It is summertime in the US, and temperatures are warmer. Several readers have asked TWTW for comments on the recent claims that July 2015 was the hottest month ever and similar announcements by certain US government entities, including branches of the National Oceanic and Atmospheric Administration (NOAA) and the National Aeronautics and Space Administration (NASA). These entities are making strong public statements that the globe continues to warm, and the future is dire. A humorist could comment that the closer we are to the 21st session of the Conference of the Parties (COP-21) of the United Nations Framework Convention on Climate Change (UNFCCC) to be held in Paris from November 30 to December 11, the hotter the globe becomes.
However, there are three significant forms of divergence that are being demonstrated. One divergence is the increasing difference between atmospheric temperatures and surface temperatures. The second divergence is the growing difference between temperatures forecast by models and observed temperatures, particularly atmospheric temperatures. This leads to the third divergence, the difference between the activities of what can be called the Climate Establishment and what is observed in nature.
The atmospheric temperatures are reported by two independent entities: the largely NASA-financed UAH entity at the University of Alabama in Huntsville, and Remote Sensing Systems (RSS) in California. The surface temperatures are reported by NOAA, NASA, and Hadley Centre of the UK Met Office, combined with those of the Climatic Research Unit (CRU) of the University of East Anglia. These measurements depend, in part, on the historic record maintained by NOAA’s National Climatic Data Center (NCDC). Unfortunately, for more than two decades, the historic record of the surface temperatures has been adjusted numerous times, without adequate records of the details and the effects. The net effect is an inflation of a warming trend, particularly obvious in the US where excellent historic records continue to exist. The UAH data have been adjusted, but the adjustments and effects have been publically recorded.
The divergence between the temperatures forecasted by the global climate models and the observed temperatures is becoming extremely obvious, particularly with the observed atmospheric temperatures. The adjustments to surface temperatures lessen this divergence somewhat, particular with the latest adjustments by the NCDC, where superior measurements taken by fixed or floating buoys were inflated to correspond with earlier, inferior measurements taken by ships. The director of NCDC, Tom Karl, was a lead author in the paper announcing this change. As a result, we should see announcements that sea surface temperatures, and global surface temperatures, are increasing, although the increase may be strictly an artifact of human adjustments rather than an occurrence in nature.
The questionable adjustments in reported surface temperatures leads to the third form of increasing divergence – the differences between what is reported by the Climate Establishment and what is occurring in nature. The Climate Establishment can be defined as those who embrace the findings of the UN Intergovernmental Panel on Climate Change (IPCC), particularly the assertion of a high confidence, a high degree of certainty, that human emissions of carbon dioxide and other greenhouse gases are causing unprecedented and dangerous global warming. Simply because data is adjusted to reflect the IPCC view, does not mean that the IPCC view is occurring.
The greenhouse effect takes place in the atmosphere, yet it is not being observed in the atmosphere. The satellite data, independently verified by four sets of weather balloon data, clearly shows it is not. There has been no significant warming for about 18 years. These data are the most comprehensive temperature data existing and are largely independent of other human influences that bias surface data such as urbanization, including building of structures and impervious surfaces, and other changes in land use. Those who broadcast claims of the hottest year ever, based on adjusted surface data, are actually emphasizing the divergence between science practiced by the Climate Establishment and Nature, and are not engaged in a natural science.
Unfortunately, many government entities and government-funded entities are involved in the Climate Establishment. The leaders of such government entities and funding entities demonstrate a lack of concern for institutional credibility, no respect for the scientific bases on which such institutions were built, including those who came before them and those who will replace them, and will leave their institutions in an inferior condition, rather than strengthen them.
It is important to note that not all government-funded entities are so involved. The National Space Science & Technology Center (NSSTC) at the University of Alabama in Huntsville (UAH), which is largely funded by the federal government (NASA) is a notable exception.
@NOAA ‘s desperate new paper: Is there no global warming ‘hiatus’ after all?
By Patrick J. Michaels, Richard S. Lindzen, and Paul C. Knappenberger | Watts Up With That? | June 4, 2015
A new paper published today by Science, from Thomas Karl and several co-authors[1], that removes the “hiatus” in global warming prompts many serious scientific questions.
The main claim[2] by the authors that they have uncovered a significant recent warming trend is dubious. The significance level they report on their findings (.10) is hardly normative, and the use of it should prompt members of the scientific community to question the reasoning behind the use of such a lax standard.
In addition, the authors’ treatment of buoy sea-surface temperature (SST) data was guaranteed to create a warming trend. The data were adjusted upward by 0.12°C to make them “homogeneous” with the longer-running temperature records taken from engine intake channels in marine vessels.
As has been acknowledged by numerous scientists, the engine intake data are clearly contaminated by heat conduction from the structure, and as such, never intended for scientific use. On the other hand, environmental monitoring is the specific purpose of the buoys. Adjusting good data upward to match bad data seems questionable, and the fact that the buoy network becomes increasingly dense in the last two decades means that this adjustment must put a warming trend in the data.
The extension of high-latitude arctic land data over the Arctic Ocean is also questionable. Much of the Arctic Ocean is ice-covered even in high summer, meaning the surface temperature must remain near freezing. Extending land data out into the ocean will obviously induce substantially exaggerated temperatures.
Additionally, there exist multiple measures of bulk lower atmosphere temperature independent from surface measurements which indicate the existence of a “hiatus”[3]. If the Karl et al., result were in fact robust, it could only mean that the disparity between surface and midtropospheric temperatures is even larger that previously noted.
Getting the vertical distribution of temperature wrong invalidates virtually every forecast of sensible weather made by a climate model, as much of that weather (including rainfall) is determined in large part by the vertical structure of the atmosphere.
Instead, it would seem more logical to seriously question the Karl et al. result in light of the fact that, compared to those bulk temperatures, it is an outlier, showing a recent warming trend that is not in line with these other global records.
And finally, even presuming all the adjustments applied by the authors ultimately prove to be accurate, the temperature trend reported during the “hiatus” period (1998-2014), remains significantly below (using Karl et al.’s measure of significance) the mean trend projected by the collection of climate models used in the most recent report from the United Nation’s Intergovernmental Panel on Climate Change (IPCC).
It is important to recognize that the central issue of human-caused climate change is not a question of whether it is warming or not, but rather a question of how much. And to this relevant question, the answer has been, and remains, that the warming is taking place at a much slower rate than is being projected.

The distribution of trends of the projected global average surface temperature for the period 1998-2014 from 108 climate model runs used in the latest report of the U.N.’s Intergovernmental Panel on Climate Change (IPCC)(blue bars). The models were run with historical climate forcings through 2005 and extended to 2014 with the RCP4.5 emissions scenario. The surface temperature trend over the same period, as reported by Karl et al. (2015, is included in red. It falls at the 2.4th percentile of the model distribution and indicates a value that is (statistically) significantly below the model mean projection.
[1] Karl, T. R., et al., Possible artifacts of data biases in the recent global surface warming hiatus. Scienceexpress, embargoed until 1400 EDT June 4, 2015.
[2] “It is also noteworthy that the new global trends are statistically significant and positive at the 0.10 significance level for 1998-2012…”
[3] Both the UAH and RSS satellite records are now in their 21st year without a significant trend, for example
[NOTE: An earlier version of this posting accidentally omitted the last two paragraphs before the graphic, they have been restored, and the error is mine – Anthony]
Skeptical of skeptics: is Steve Goddard right?
By Judith Curry | Climate Etc. | June 28, 2014
Skeptics doing what skeptics do best . . . attack skeptics. – Suyts
Last week, the mainstream media was abuzz with claims by skeptical blogger Steve Goddard that NOAA and NASA have dramatically altered the US temperature record. For examples of MSM coverage, see:
- Telegraph: The Scandal of Fiddled Global Warming Data
- Washington Times: Rigged ‘science’
- RealClearPolitics: Climate Change: Who are the real deniers?
Further, this story was carried as the lead story on Drudge for a day.
First off the block to challenge Goddard came Ronald Bailey at reason.com in an article Did NASA/NOAA Dramatically Alter U.S. Temperatures After 2000? that cites communication with Anthony Watts, who is critical of Goddard’s analysis, as well as being critical of NASA/NOAA.
Politifact chimed in with an article that assessed Goddard’s claims, based on Watt’s statements and also an analysis by Zeke Hausfather. Politifact summarized with this statement: We rate the claim Pants on Fire.
I didn’t pay much attention to this, until Politifact asked me for my opinion. I said that I hadn’t looked at it myself, but referred them to Zeke and Watts. I did tweet their Pants on Fire conclusion.
Skepticism in the technical climate blogosphere
Over at the Blackboard, Zeke Hausfather has a three-part series about Goddard’s analysis – How not to calculate temperatures (Part I, Part II, Part III). Without getting into the technical details here, the critiques relate to the topics of data dropout, data infilling/gridding, time of day adjustments, and the use of physical temperatures versus anomalies. The comments thread on Part II is very good, well worth reading.
Anthony Watts has a two-part series On denying hockey sticks, USHCN data and all that (Part 1, Part 2). The posts document Watts’ communications with Goddard, and make mostly the same technical points as Zeke. There are some good technical comments in Part 2, and Watts makes a proposal regarding the use of US reference stations.
Nick Stokes has two technical posts that relate to Goddard’s analysis: USHCN adjustments, averages, getting it right and TOBS nailed.
While I haven’t dug into all this myself, the above analyses seem robust, and it seems that Goddard has made some analysis errors.
The data
OK, acknowledging that Goddard made some analysis errors, I am still left with some uneasiness about the actual data, and why it keeps changing. For example, Jennifer Marohasy has been writing about Corrupting Australian’s temperature record.
In the midst of preparing this blog post, I received an email from Anthony Watts, suggesting that I hold off on my post since there is some breaking news. Watts pointed me to a post by Paul Homewood entitled Massive Temperature Adjustments At Luling, Texas. Excerpt:
So, I thought it might be worth looking in more detail at a few stations, to see what is going on. In Steve’s post, mentioned above, he links to the USHCN Final dataset for monthly temperatures, making the point that approx 40% of these monthly readings are “estimated”, as there is no raw data.
From this dataset, I picked the one at the top of the list, (which appears to be totally random), Station number 415429, which is Luling, Texas.
Taking last year as an example, we can see that ten of the twelve months are tagged as “E”, i.e estimated. It is understandable that a station might be a month, or even two, late in reporting, but it is not conceivable that readings from last year are late. (The other two months, Jan/Feb are marked “a”, indicating missing days).
But, the mystery thickens. Each state produces a monthly and annual State Climatological Report, which among other things includes a list of monthly mean temperatures by station. If we look at the 2013 annual report for Texas, we can see these monthly temperatures for Luling.
Where an “M” appears after the temperature, this indicates some days are missing, i.e Jan, Feb, Oct and Nov. (Detailed daily data shows just one missing day’s minimum temperature for each of these months).
Yet, according to the USHCN dataset, all ten months from March to December are “Estimated”. Why, when there is full data available?
But it gets worse. The table below compares the actual station data with what USHCN describe as “the bias-adjusted temperature”. The results are shocking.
In other words, the adjustments have added an astonishing 1.35C to the annual temperature for 2013. Note also that I have included the same figures for 1934, which show that the adjustment has reduced temperatures that year by 0.91C. So, the net effect of the adjustments between 1934 and 2013 has been to add 2.26C of warming.
Note as well, that the largest adjustments are for the estimated months of March – December. This is something that Steve Goddard has been emphasising.
It is plain that these adjustments made are not justifiable in any way. It is also clear that the number of “Estimated” measurements made are not justified either, as the real data is there, present and correct.
Watts appears in the comments, stating that he has contacted John Nielsen-Gammon (Texas State Climatologist) about this issue. Nick Stokes also appears in the comments, and one commenter finds a similar problem for another Texas station.
Homewood’s post sheds light on Goddard’s original claim regarding the data drop out (not just stations that are no longer reporting, but reporting stations that are ‘estimated’). I infer from this that there seems to be a real problem with the USHCN data set, or at least with some of the stations. Maybe it is a tempest in a teacup, but it looks like something that requires NOAA’s attention. As far as I can tell, NOAA has not responded to Goddard’s allegations. Now, with Homewood’s explanation/clarification, NOAA really needs to respond.
Sociology of the technical skeptical blogosphere
Apart from the astonishing scientific and political implications of what could be a major bug in the USHCN dataset, there are some interesting insights and lessons from this regarding the technical skeptical blogosphere.
Who do I include in the technical skeptical blogosphere? Tamino, Moyhu, Blackboard, Watts, Goddard, ClimateAudit, Jeff Id, Roman M. There are others, but the main discriminating factor is that they do data analysis, and audit the data analysis of others. Are all of these ‘skeptics’ in the political sense? No – Tamino and Moyhu definitely run warm, with Blackboard and a few others running lukewarm. Of these, Goddard is the most skeptical of AGW. There is most definitely no tribalism among this group.
In responding to Goddard’s post, Zeke, Nick Stokes (Moyhu) and Watts may have missed the real story. They focused on their previous criticism of Goddard and missed his main point. Further, I think there was an element of ‘boy who cried wolf’ – Goddard has been wrong before, and the comments at Goddard’s blog can be pretty crackpotty. However, the main point is that this group is rapidly self-correcting – the self-correcting function in the skeptical technical blogosphere seems to be more effective (and certainly faster) than for establishment climate science.
There’s another issue here and that is one of communication. Why was Goddard’s original post unconvincing to this group, whereas Homewood’s post seems to be convincing? Apart from ‘crying wolf’ issue, Goddard focused on the message that the real warming was much less than portrayed by the NOAA data set (caught the attention of the mainstream media), whereas Homewood more carefully documented the actual problem with the data set.
I’ve been in email communications with Watts through much of Friday, and he’s been pursuing the issue along with Zeke and help from Neilsen-Gammon to NCDC directly, who is reportedly taking it seriously. Not only does Watts plan to issue a statement on how he missed Goddard’s original issue, he says that additional problems have been discovered and that NOAA/NCDC will be issuing some sort of statement, possibly also a correction, next week. (Watts has approved me making this statement).
This incident is another one that challenges traditional notions of expertise. From a recent speech by President Obama:
“I mean, I’m not a scientist either, but I’ve got this guy, John Holdren, he’s a scientist,” Obama added to laughter. “I’ve got a bunch of scientists at NASA and I’ve got a bunch of scientists at EPA.”
Who all rely on the data prepared by his bunch of scientists at NOAA.
How to analyze the imperfect and heterogeneous surface temperature data is not straightforward – there are numerous ways to skin this cat, and the cat still seems to have some skin left. I like the Berkeley Earth methods, but I am not convinced that their confidence interval/uncertainty estimates are adequate.
Stay tuned, I think this one bears watching.
Mummy, The Ocean’s Eaten My Heat!!
By Paul Homewood | Not A Lot Of People Know That | September 24, 2013
I’ve been meaning to post on this for a while. We often hear the claim that all of the missing heat has been gobbled up by the oceans.
Now, let’s leave aside some of the obvious problems with this theory, such as:
- How all of this heat has selectively and mysteriously managed to avoid land areas.
- How warm water has managed to sink instead of rise.
- How the water at, or near, the surface seems to have escaped this warming.
And get straight to the nub of the matter.
Water has a much higher heat capacity than air. According to NOAA,
The oceans store more heat in the uppermost 3 meters (10 feet) than the entire atmosphere (above it).
So let’s run some very simple calculations.
In the last decade, most models were predicting something of the order of 0.2C global warming. If, instead of warming the atmospheric , this extra heat has gone into the sea, its effects will be much diluted, with the result that increases in sea temperatures will be much, much less than 0.2C.
(Remember, it takes much more energy to warm a bucket of water by 1C than a bucket of air.)
The suggestion is that, as there has been no noticeable warming in the upper 100 meters, this “hidden heat” is as far as 2000 meters down.
So, ocean temperature should have increased by:
2000 Meters Divided By 3 Meters = 666.6
0.2C Divided By 666.6 = 0.0003C
The idea that we can:
- measure sea temperatures throughout all the oceans of the world
- measure it throughout the whole depth down to 2000 meters and more.
- take into account seasonal changes
- take into account shifting ocean cycles and currents.
and still be able to measure the overall temperature to better than three ten thousandths of a degree is patent nonsense.
So step forward Professor Ted Shepherd, a leading atmospheric scientist and recently installed as Grantham Chair in Climate Science at Reading University.
He had this to say to the Guardian.
“The heat is still coming in, but it appears to have gone into the deep ocean and, frustratingly, we do not have the instruments to measure there,”
Or to put it another way, we have no idea whether it is or not, but in the meantime we’ll still cling to our theory.
Featured Video

Yemen joins the war – Red Sea could be blocked next – Saudi regime at risk
or go to
Aletho News Archives – Video-Images
From the Archives
Should Europeans ‘Thank’ the Americans for Destroying Nord Stream?
By Robert Bridge | Strategic Culture Foundation | September 29, 2022
With an investigation continuing into the destruction of the Nord Stream gas pipeline that provided energy supplies to Europe from Russia, there appears to be just one prime suspect, and that should surprise nobody.
Following the sabotage of the Nord Stream 1 and 2 gas pipelines, former Polish Foreign Minister Radoslaw Sikorski already seemed to know the identity of the perpetrator when he tweeted out: “Thank you, USA.”
At first glance, it seemed that Sikorski was speaking sarcastically, berating Washington for carrying out an attack that will have severe repercussions for the people of Europe. After all, how could anyone see any good coming from the termination of Europe’s primary source of gas reserves with winter just around the corner? It was Sikorski’s homeland of Poland, after all, that urged its citizens to collect firewood in the face of dwindling gas reserves.
In fact, the Polish diplomat was speaking one-hundred percent literally… continue
Blog Roll
 Aletho News
- US should start removing its troops for Germany, proposes AfD co-leader Chrupalla
- Iran Red Crescent: 600 educational centers attacked in US-Israeli ‘war crimes’
- Russian Oil Tanker Arrives in Cuba Amid U.S. Blockade
- America Racing to Strategic Defeat in Iran: Lt Col Daniel Davis
- FTC Warns Visa, Mastercard, PayPal, Stripe Over Political Debanking
- Russian tanker approaches Cuba despite US oil blockade
- Marandi: Yemen joins the war – Red Sea could be blocked next – Saudi regime at risk
- Pro-Palestinian French member of European Parliament denied entry to Canada
- Pakistan to Host US-Iran Talks
- How Indonesia’s tilt toward the US left it stranded in the Strait of Hormuz
- If Americans Knew
- Israeli police block Catholic cardinal from entering Church of the Holy Sepulchre on Palm Sunday
- Israel is assassinating journalists again, more than any other nation, anywhere, ever – Not a ceasefire Day 170
- Over 300 US service members wounded, majority have brain injuries – Not a ceasefire Day 169
- Researchers at Human Rights Watch Resign Over Blocked Report on Palestinian Refugee Return
- Jewish Groups Are Backing a War Americans Don’t Want
- Eric Fingerhut Thinks He’s the President of the Jews
- Top Jewish Philanthropists, Rabbis Urge Israeli President to Take Action Against ‘Jewish Extremists’
- Don’t Be Fooled. Zionist Leaders Have Always Wanted to Control Southern Lebanon
- Israel’s widespread use of torture is a core element of its genocide against the Palestinian people
- In Israel’s War on Iran, Many Middle East US Bases Rendered “All But Uninhabitable”
- No Tricks Zone
- New Study Finds Warming Saves Lives…Cold Temperatures 12 Times More Deadly Than Excess Heat
- German Science Blog Accuses PIK Climate Institute Of Hallucinating Climate Tipping Points
- Devastating Assessment Of Comirnaty Vaccine By Former Senior Pfizer Europe Toxicologist
- New Study: CO2 Is ‘Effectively Negligible’ As An Explanatory Climate Change Factor Since 2000
- Former Pfizer Toxicologist Dr. Helmut Sterz Tells Bundestag Hearing Pfizer Vaccine Should Have Never Been Approved
- Energy Expert: Germany’s Nuclear Phaseout Was A “500 Billion Euro Mistake”
- New Research: South Australia’s Mid-Holocene Sea Surface Temperatures Were 4°C Warmer Than Today
- Storing Green Energy To Last Germany 10 Days Would Require A 60-Million Tonne Battery
- New Studies: UK Sea Levels Were 4 Meters Higher Than Today During The Mid-Holocene
- Destructive Green New Deal: German Energy And Metal Group Warns Of Drastic Crisis
