Catastrophe Denied
This video is a critique of catastrophic man-made global warming theory, based on presentation slides used in a series of public presentations and debates in late 2009 and early 2010. The author is Warren Meyer, author of the web site climate-skeptic.com.
Sea level rise tipping points
By Rud Istvan | Climate Etc. | May 18, 2014
Sea level tipping points are a popular CAGW/media theory, easily suggested by images of calving icebergs and summer meltwater rushing down Greenland moulins. But they are alarmist precautionary mitigation fantasies rather than remotely possible future scenarios on multi-centennial time scales.
The core tenant of catastrophic anthropogenic global warming (CAGW) is that rising CO2 will raise temperatures and result in various catastrophes. IPCC, UNFCC and now the US NCA have argued this requires immediate drastic collective mitigation. Nature has not co-operated. Temperatures stopped rising (the pause), extreme weather did not increase (IPCC SREX), Australian drought turned to flood, Tuvalu has not disappeared, and polar bears thrive. So AR5 WG2 finally said adaptation might be a better response.
About the only urgent immediate mitigation rationale left is the precautionary principle: take expensive actions as just in case ‘insurance’. Precautions against some ‘tipping point’ beyond which the world is rapidly, disastrously, and irreversibly affected, which point at any cost we therefore dare not risk passing. No price is too high to pay to avoid a catastrophic tipping point according to this precautionary principle. Bad economics piled onto bad science.
One of the most marketed tipping points is sea level rise (SLR). The problem with ‘sudden’ SLR is that it did not happen in the Eemian interglacial. But that does not say it might not with CAGW added to this one, the Holocene.
There are only three ice bodies with enough water to cause a potentially rapid and large sea level rise. These are the Greenland, East Antarctic, and West Antarctic Ice Sheets. Since Antarctica as a whole may (inconveniently for CAGW) be accumulating ice [i], Greenland has been the ‘tipping point’ most frequently mentioned by official agencies [ii] and by the MSM. [iii]
There is no doubt that Greenland is losing ice mass, and at a recently increased rate. This has been measured in different ways (ice melt boundary, gravity (GRACE), iceberg calving… The ‘consensus’ is about 170- 200 Gt per year recently, but about 100Gtpy over satellite era Arctic cycles since the estimated loss was only about 7Gtpy in the 1990s.[iv] Winter snow accumulation is as important to net ice mass balance as the summer melt.
The observed mass loss should be put into perspective. According to the Byrd Polar Research Center the Greenland Ice Sheet comprises 2.62-2.93 E+6 km3. That is a total mass of about 2.67E+18Kg (uncertainty on volume, and uncertainty on density—firn, moulins, entrained air). A gigaton is E+12Kg. Greenland is estimated to be losing about E+14Kg per year averaged over two decades. At that rate, it would take about (2.67 E+18kg mass/E+14kg average annual mass loss) 27000 years to melt/sluff. Even the recent accelerated rate (if continued) would take over 14000 years.[v] That is longer than it took the great Laurentide Ice Sheet to disappear at the end of the last ice age. If Greenland ever did melt it would raise sea level by 6.7 meters. Even at the faster melt rate this would be (670 cm/140 centuries) 4.8 cm/century of sea– an additional 0.5mm/yr—more adaptation than mitigation.
It is unlikely that Greenland will melt. NEEM showed northwest Greenland was +5-8°C above the present for about 7 millennia during the Eemian. True, more ice melted there then than has up to now in the Holocene. The NEEM site cored ‘only’ 2537 meters of ice. At end of the Eemian the NEEM location ice was about 130 meters lower—‘only’ ≈2400 meters thick.
The only way a centennial or even millennial Greenland tipping point would be possible is if much of its ice ‘slid off’. It is true that the outer ice sheet edges are glaciers creeping seaward and sluffing—calving icebergs like the one that sank the Titanic in 1912 (before AGW). But it is not true that most of the Greenland ice sheet could ever creep off, since the underlying bedrock is bowl shaped. The most graphic 3D visualization is from Bamber, University of Bristol.

The thickest ice is over the deepest part of a bedrock bowl 1000-2500 meters deep, e.g. at the NEEM site. It is not going anywhere anytime soon. That ‘bowl’ interior is where the Greenland Sheet has been accumulating even as the edges sluff/melt. Creep decline becomes increasingly self-limited by underlying geology.

Greenland losing all its ice is geophysically impossible on millennial time scales, since it has to melt. Not something to worry about at all on centennial time scales, even as an implausible black swan or dragon king.
With Greenland geologically debunked as a possible SLR tipping point, attention turned to Antarctica. Whether Antarctica in total is gaining or losing ice is a matter of dispute between NASA and NOAA. Current NOAA ice loss is:

WAIS losing, EAIS gaining, the Peninsula about even. So any tipping point has to be sought in West Antarctica (WAIS). The general WAIS slope is from the Transarctic Mountain divide down to the sea, although some is anchored by the Executive Committee and Ellsworth mountain ranges.

Potential WAIS instability has been the subject of much scientific scrutiny. The original concerns were the large below sea level grounded portions of the Ronne (which is not part of WAIS but is still mostly in the Western half of Antarctica) and Ross ice shelves. (Floating shelf ice cannot further raise sea levels.) These have the largest volumes of ice creeping toward the sea. Like Greenland, much of the rest (and most of EAIS) is land anchored by underlying bedrock topology. On an annual basis fresh snow still replenishes most of the lost edge mass inland at higher WAIS elevations. It is the net mass balance along these seaward sloping WAIS ice sheet edges that might constitute sufficiently large tipping points.
 Ronne (1) is net gaining ice mass according to NASA. So it isn’t a plausible tipping point. Ross (19) might or might not be losing ice, but it is what ‘holds back’ almost half of WAIS. Ross also has more ice grounded deeper on the seabed, which if ungrounded (melted from below), would raise sea levels more. For years Ross was the main WAIS instability ‘tipping point’ concern.
 The ANDRILL program was designed to look at the underlying Ross seabed (both where the ice is grounded below sea level, and where it is floating shelf) to understand its behavior in previous interglacials. Andrill cores and creep rates suggest it has not before (well, for at least 3 million years and the entire Pleistocene Ice Age) and likely will not now collapse. The Ross shelf’s seaward creep has decelerated. [vi],[vii] Ross had bedrock islands ‘anchoring’ its grounded ice, retarding seaward creep. [viii] So Ross is not a plausible tipping point after all.
So 2014 attention turned to the only other possibility, the Amundsen Embayment, which is indisputably losing ice at an accelerating rate. Abetted by additional NASA PR and author interviews (Rignot of NASA JPL “Already gone into irreversible retreat, past the point of no return”), MSM alarmist headlines were, well, alarming. Reuters reported worldwide: “West Antarctic Glaciers in irreversible thaw: rising seas” CNN said: “Ice melt in part of Antarctica ‘appears unstoppable’, NASA says”
The MSM did not read these new papers carefully or in context (if at all). The first paper found Pine Island (22) plus Thwaites (21) plus the four lesser Amundsen Embayment glaciers are discharging ice more rapidly than all of Greenland (together ±330Gtyr). That is surprisingly 3-4x higher than any previous estimate, for example those also from NASA in 2011 shown above. The second paper used computer models of Thwaites (21) bottom melting to conclude it couldbecome unstable in 200 to 900 years. If so, the computer models suggested 1mm/yr of additional SLR thereafter. Not ‘in coming decades’ as Reuters said and NASA PR implied.
There is a deeper comprehension problem in this new NASA sponsored version of a SLR tipping point. The NASA NEWS about these papers says the Embayment region contains enough ice to raise global sea level by 4 feet (1.2 meters). That is true for the entire catchment basin of about 360,000 km2. [ix]For 1.2 meters of SLR, the entire catchment would have to become entirely ice free. That is highly unlikely. The interior portions are not flowing much toward the sea according to the first paper itself, and are also still accumulating ice. [x], [xi]

Sea level tipping points are a popular CAGW/media theory, easily suggested by images of calving icebergs and summer meltwater rushing down Greenland moulins. But they are alarmist precautionary mitigation fantasies rather than remotely possible future scenarios on multi-centennial time scales.
AR5 WG2 had it right that the best response to SLR is adaptation. Major coastal cities like New Orleans (3-10mm/yr), Jakarta (6-22mm/yr), and Bangkok (10-28mm/yr) are already subsiding at much faster rates than sea levels are or will foreseeably be rising.
AGW has most of the characteristics of an “urban legend”
By Roy W. Spencer, Ph. D. | Watts Up With That? | October 24, 2009
About.com describes an “urban legend” as an apocryphal (of questionable authenticity), secondhand story, told as true and just plausible enough to be believed, about some horrific…series of events….it’s likely to be framed as a cautionary tale. Whether factual or not, an urban legend is meant to be believed. In lieu of evidence, however, the teller of an urban legend is apt to rely on skillful storytelling and reference to putatively trustworthy sources.
I contend that the belief in human-caused global warming as a dangerous event, either now or in the future, has most of the characteristics of an urban legend. Like other urban legends, it is based upon an element of truth. Carbon dioxide is a greenhouse gas whose concentration in the atmosphere is increasing, and since greenhouse gases warm the lower atmosphere, more CO2 can be expected, at least theoretically, to result in some level of warming.
But skillful storytelling has elevated the danger from a theoretical one to one of near-certainty. The actual scientific basis for the plausible hypothesis that humans could be responsible for most recent warming is contained in the cautious scientific language of many scientific papers. Unfortunately, most of the uncertainties and caveats are then minimized with artfully designed prose contained in the Summary for Policymakers (SP) portion of the report of the UN’s Intergovernmental Panel on Climate Change (IPCC). This Summary was clearly meant to instill maximum alarm from a minimum amount of direct evidence.
Next, politicians seized upon the SP, further simplifying and extrapolating its claims to the level of a “climate crisis”. Other politicians embellished the tale even more by claiming they “saw” global warming in Greenland as if it was a sighting of Sasquatch, or that they felt it when they fly in airplanes.
Just as the tales of marauding colonies of alligators living in New York City sewers are based upon some kernel of truth, so too is the science behind anthropogenic global warming. But there is a big difference between reports of people finding pet alligators that have escaped their owners, versus city workers having their limbs torn off by roving colonies of subterranean monsters.
In the case of global warming, the “putatively trustworthy sources” would be the consensus of the world’s scientists. The scientific consensus, after all, says that global warming is… is what? Is happening? Is severe? Is man-made? Is going to burn the Earth up if we do not act? It turns out that those who claim consensus either do not explicitly state what that consensus is about, or they make up something that supports their preconceived notions.
If the consensus is that the presence of humans on Earth has some influence on the climate system, then I would have to even include myself in that consensus. After all, the same thing can be said of the presence of trees on Earth, and hopefully we have at least the same rights as trees do. But too often the consensus is some vague, fill-in-the-blank, implied assumption where the definition of “climate change” includes the phrase “humans are evil”.
It is a peculiar development that scientific truth is now decided through voting. A relatively recent survey of climate scientists who do climate research found that 97.4% agreed that humans have a “significant” effect on climate. But the way the survey question was phrased borders on meaninglessness. To a scientist, “significant” often means non-zero. The survey results would have been quite different if the question was, “Do you believe that natural cycles in the climate system have been sufficiently researched to exclude them as a potential cause of most of our recent warming?”
And it is also a good bet that 100% of those scientists surveyed were funded by the government only after they submitted research proposals which implicitly or explicitly stated they believed in anthropogenic global warming to begin with. If you submit a research proposal to look for alternative explanations for global warming (say, natural climate cycles), it is virtually guaranteed you will not get funded. Is it any wonder that scientists who are required to accept the current scientific orthodoxy in order to receive continued funding, then later agree with that orthodoxy when surveyed? Well, duh.
In my experience, the public has the mistaken impression that a lot of climate research has gone into the search for alternative explanations for warming. They are astounded when I tell them that virtually no research has been performed into the possibility that warming is just part of a natural cycle generated within the climate system itself.
Too often the consensus is implied to be that global warming is so serious that we must do something now in the form of public policy to avert global catastrophe. What? You don’t believe that there are alligators in New York City sewer system? How can you be so unconcerned about the welfare of city workers that have to risk their lives by going down there every day? What are you, some kind of Holocaust-denying, Neanderthal flat-Earther?
It makes complete sense that in this modern era of scientific advances and inventions that we would so readily embrace a compelling tale of global catastrophe resulting from our own excesses. It’s not a new genre of storytelling, of course, as there were many B-movies in the 1950s whose horror themes were influenced by scientists’ development of the atomic bomb.
Our modern equivalent is the 2004 movie, “Day After Tomorrow”, in which all kinds of physically impossible climatic events occur in a matter of days. In one scene, super-cold stratospheric air descends to the Earth’s surface, instantly freezing everything in its path. The meteorological truth, however, is just the opposite. If you were to bring stratospheric air down to the surface, heating by compression would make it warmer than the surrounding air, not colder.
I’m sure it is just coincidence that “Day After Tomorrow” was directed by Roland Emmerich, who also directed the 2006 movie “Independence Day,” in which an alien invasion nearly exterminates humanity. After all, what’s the difference? Aliens purposely killing off humans, or humans accidentally killing off humans? Either way, we all die.
But a global warming catastrophe is so much more believable. After all, climate change does happen, right? So why not claim that ALL climate change is now the result of human activity? And while we are at it, let’s re-write climate history so that we get rid of the Medieval Warm Period and the Little Ice age, with a new ingenious hockey stick-shaped reconstruction of past temperatures that makes it look like climate never changed until the 20th Century? How cool would that be?
The IPCC thought it was way cool… until it was debunked, after which it was quietly downgraded in the IPCC reports from the poster child for anthropogenic global warming, to one possible interpretation of past climate.
And let’s even go further and suppose that the climate system is so precariously balanced that our injection of a little bit of that evil plant food, carbon dioxide, pushes our world over the edge, past all kinds of imaginary tipping points, with the Greenland ice sheet melting away, and swarms of earthquakes being the price of our indiscretions.
In December, hundreds of bureaucrats from around the world will once again assemble, this time in Copenhagen, in their attempts to forge a new international agreement to reduce greenhouse gas emissions as a successor to the Kyoto Protocol. And as has been the case with every other UN meeting of its type, the participants simply assume that the urban legend is true. Indeed, these politicians and governmental representatives need it to be true. Their careers and political power now depend upon it. And the fact that they hold their meetings in all of the best tourist destinations in the world, enjoying the finest exotic foods, suggests that they do not expect to ever have to be personally inconvenienced by whatever restrictions they try to impose on the rest of humanity.
If you present these people with evidence that the global warming crisis might well be a false alarm, you are rewarded with hostility and insults, rather than expressions of relief. The same can be said for most lay believers of the urban legend. I say “most” because I once encountered a true believer who said he hoped my research into the possibility that climate change is mostly natural will eventually be proved correct.
Unfortunately, just as we are irresistibly drawn to disasters – either real ones on the evening news, or ones we pay to watch in movie theaters – the urban legend of a climate crisis will persist, being believed by those whose politics and worldviews depend upon it. Only when they finally realize what a new treaty will cost them in loss of freedoms and standard of living will those who oppose our continuing use of carbon-based energy begin to lose their religion.
Related article
- What Defines A Scientist? (wattsupwiththat.com)

Solar warnings, global warming and crimes against humanity
Malaysian Realist
We’ve been seeing a lot of unexpectedly cool weather across the world. While this may be explained by local phenomenon such as the Northeast Monsoon in Malaysia and the Polar Vortex in the USA, a longer term trend of worldwide cooling is headed our way.
I say this because the sun – the main source of light and heat for our planet – is approaching a combined low point in output. Solar activity rises and falls in different overlapping cycles, and the low points of several cycles will coincide in the near future:
A) 11-year Schwabe Cycle which had a minimum in 2008 and is due for the next minimum in 2019, then 2030. Even at its recent peak (2013) the sun had its lowest recorded activity in 200 years.
B) 87-year Gleissberg cycle which has a currently ongoing minimum period from 1997 – 2032, corresponding to the observed ‘lack of global warming’ (more on that later).
C) 210-year Suess cycle which has its next minimum predicted to be around 2040.
Hence, solar output will very likely drop to a substantial low around 2030 – 2040. This may sound pleasant for Malaysians used to sweltering heat, but it is really not a matter to be taken lightly. Previous lows such as the Year Without A Summer (1816) and the Little Ice Age (16th to 19th century) led to many deaths worldwide from crop failures, flooding, superstorms and freezing winters.
But what about the much-ballyhooed global warming, allegedly caused by increasing CO2 levels in the atmosphere? Won’t that more than offset the coming cooling, still dooming us all to a feverish Earth?
Regarding this matter, it is now a plainly accepted fact that there has been no global temperature rise in the past 25 years. This lack of warming is openly admitted by: NASA; The UK Met Office; the University of East Anglia Climatic Research Unit, as well as its former head Dr. Phil Jones (of the Climategate data manipulation controversy); Hans von Storch (Lead Author for Working Group I of the IPCC); James Lovelock (inventor of the Gaia Theory); and media entities the BBC, Forbes, Reuters, The Australian, The Economist, The New York Times, and The Wall Street Journal.
And this is despite CO2 levels having risen more than 13%, from 349 ppm in 1987 to 396ppm today. The central thesis of global warming theory – that rising CO2 levels will inexorably lead to rising global temperatures, followed by environmental catastrophe and massive loss of human life – is proven false.

(All the above are clearly and cleanly depicted by graphs, excerpts, citations and links in my collection at http://globalwarmingisunfactual.wordpress.com – as a public service.)
This is probably why anti-CO2 advocates now warn of ‘climate change’ instead. But pray tell, exactly what mechanism is there for CO2 to cause climate change if not by warming? The greenhouse effect has CO2 trapping solar heat and thus raising temperatures – as we have been warned ad nauseum by climate alarmists – so how does CO2 cause climate change when there is no warming?
Solar activity is a far larger driver of global temperature than CO2 levels, because after all, without the sun there would be no heat for greenhouse gases to trap in the first place. (Remember what I said about the Gleissberg cycle above?)
And why is any of this important to you and I? It matters because countless resources are being spent to meet the wrong challenges. Just think of all the time, energy, public attention and hard cash that have already been squandered on biofuel mandates, subsidies for solar panels and wind turbines, carbon caps and credits, bloated salaries of dignitaries, annual jet-setting climate conferences in posh five-star hotels… To say nothing of the lost opportunities and jobs (two jobs lost for every one ‘green’ job created in Spain, which now has 26% unemployment!). And most of the time it is the common working man, the taxpayer, you and I who foot the bill.
What if all this immense effort and expenditure had been put towards securing food and clean water for the impoverished (combined 11 million deaths/year)? Or fighting dengue and malaria (combined 1.222 million deaths/year)? Or preserving rivers, mangroves, rainforests and endangered species? Or preparing power grids for the increased demand that more severe winters will necessitate – the same power grids now crippled by shutting down reliable coal plants in favour of highly intermittent wind turbines?
In the face of such dire needs that can be met immediately and effectively, continuing to throw away precious money to ‘possibly, perhaps, maybe one day’ solve the non-problem of CO2 emissions is foolish, arrogant and arguably malevolent. To wit, the UN World Food Programme just announced that they are forced to scale back aid to some of the 870 million malnourished worldwide due to a $1 billion funding shortfall and the challenges of the ongoing Syrian crisis. To put this is context, a billion is a mere pittance next to the tens of billions already flushed away by attempted adherence to the Kyoto Protocol (€6.2 billion for just Germany in just 2005 alone!).
During the high times for global warmist doomsaying, sceptics and realists who questioned the unproven theories were baselessly slandered as ‘anti-science’, ‘deniers’, ‘schills for big oil’… Or even ‘war criminals’ deserving Nuremberg-style trials for their ‘crimes against humanity’!
Now that the tables are turned, just let it be known that it was not the sceptics who flushed massive amounts of global resources down the drain – while genuine human and environmental issues languished and withered in the empty shadow of global warming hysteria. Crimes against humanity, indeed.
Related articles


CRISES IN CLIMATOLOGY
By Donald C. Morton | Watts Up With That? | February 17, 2014
Herzberg Program in Astronomy and Astrophysics, National Research Council of Canada
ABSTRACT
The Report of the Intergovernmental Panel on Climate Change released in September 2013 continues the pattern of previous ones raising alarm about a warming earth due to anthropogenic greenhouse gases. This paper identifies six problems with this conclusion – the mismatch of the model predictions with the temperature observations, the assumption of positive feedback, possible solar effects, the use of a global temperature, chaos in climate, and the rejection of any skepticism.
THIS IS AN ASTROPHYSICIST’S VIEW OF CURRENT CLIMATOLOGY. I WELCOME CRITICAL COMMENTS.
1. INTRODUCTION
Many climatologists have been telling us that the environment of the earth is in serious danger of overheating caused by the human generation of greenhouse gases since the Industrial Revolution. Carbon dioxide (CO2) is mainly to blame, but methane (CH4), nitrous oxide (N2O) and certain chlorofluorocarbons also contribute.
“As expected, the main message is still the same: the evidence is very clear that the world is warming, and that human activities are the main cause. Natural changes and fluctuations do occur but they are relatively small.” – John Shepard in the United Kingdom, 2013 Sep 27 for the Royal Society.
“We can no longer ignore the facts: Global warming is unequivocal, it is caused by us and its consequences will be profound. But that doesn’t mean we can’t solve it.” -Andrew Weaver in Canada, 2013 Sep 28 in the Globe and Mail.
“We know without a doubt that gases we are adding to the air have caused a planetary energy imbalance and global warming, already 0.8 degrees Celsius since pre-industrial times. This warming is driving an increase in extreme weather from heat waves to droughts and wild fires and stronger storms . . .” – James Hansen in United States, 2013 Dec 6 CNN broadcast.
Are these views valid? In the past eminent scientists have been wrong. Lord Kelvin, unaware of nuclear fusion, concluded that the sun’s gravitational energy could keep it shining at its present brightness for only 107 years. Sir Arthur Eddington correctly suggested a nuclear source for the sun, but rejected Subrahmanyan Chandrasekhar’s theory of degenerate matter to explain white dwarfs. In 1983 Chandrasekhar received the Nobel Prize in Physics for his insight.
My own expertise is in physics and astrophysics with experience in radiative transfer, not climatology, but looking at the discipline from outside I see some serious problems. I presume most climate scientists are aware of these inconsistencies, but they remain in the Reports of the Intergovernmental Panel on Climate Change (IPCC), including the 5th one released on 2013 Sep 27. Politicians and government officials guiding public policy consult these reports and treat them as reliable.
2. THEORY, MODELS AND OBSERVATIONS
A necessary test of any theory or model is how well it predicts new experiments or observations not used in its development. It is not sufficient just to represent the data used to produce the theory or model, particularly in the case of climate models where many physical processes too complicated to code explicitly are represented by adjustable parameters. As John von Neumann once stated “With four parameters I can fit an elephant, and with five I can make him wiggle his trunk.” Four parameters will not produce all the details of an elephant, but the principle is clear. The models must have independent checks.

Fig. 1. Global Average Temperature Anomaly (°C) upper, and CO2 concentration (ppm) lower graphs from http://www.climate.gov/maps-data by the U.S. National Oceanic and Atmospheric Administration. The extension of the CO2 data to earlier years is from the ice core data of the Antarctic Law Dome ftp://ftp.ncdc.noaa.gov/pub/data/paleo/icecore/antarctica/law/law_co2.txt.
The upper plot in Fig. 1 shows how global temperatures have varied since 1880 with a decrease to 1910, a rise until 1945, a plateau to 1977, a rise of about 0.6 ºC until 1998 and then essentially constant for the next 16 years. Meanwhile, the concentration of CO2 in our atmosphere has steadily increased. Fig. 2 from the 5th Report of the Intergovernmental Panel on Climate Change (2013) shows that the observed temperatures follow the lower envelope of the predictions of the climate models.

Fig. 2. Model Predictions and Temperature Observations from IPCC Report 2013. RCP 4.5 (Representative Concentration Pathway 4.5) labels a set of models for a modest rise in anthropogenic greenhouse gases corresponding to an increase of 4.5 Wm–2 (1.3%) in total solar irradiance.
Already in 2009 climatologists worried about the change in slope of the temperature curve. At that time Knight et al. (2009) asked the rhetorical question “Do global temperature trends over the last decade falsify climate predictions?” Their response was “Near-zero and even negative trends are common for intervals of a decade or less in the simulations, due to the model’s internal climate variability. The simulations rule out (at the 95% level) zero trends for intervals of 15 yr or more, suggesting that an observed absence of warming of this duration is needed to create a discrepancy with the expected present-day warming rate.”
Now some climate scientists are saying that 16 years is too short a time to assess a change in climate, but then the rise from 1978 to 1998, which was attributed to anthropogenic CO2, also could be spurious. Other researchers are actively looking into phenomena omitted from the models to explain the discrepancy. These include
1) a strong natural South Pacific El Nino warming event in 1998 so the plateau did not begin until 2001,
2) an overestimate of the greenhouse effect in some models,
3) inadequate inclusion of clouds and other aerosols in the models, and
4) a deep ocean reservoir for the missing heat.
Extra warming due to the 1978 El Nino seems plausible, but there have been others that could have caused some of the earlier warming and there are also cooling La Nina events. All proposed causes of the plateau must have their effects on the warming also incorporated into the models to make predictions that then can be tested during the following decade or two of temperature evolution.
3. THE FEEDBACK PARAMETER
There is no controversy about the basic physics that adding CO2 to our atmosphere absorbs solar energy resulting in a little extra warming on top of the dominant effect of water vapor. The CO2 spectral absorption is saturated so is proportional to the logarithm of the concentration. The estimated effect accounts for only about half the temperature rise of 0.8 ºC since the Industrial Revolution. Without justification the model makers ignored possible natural causes and assumed the rise was caused primarily by anthropogenic CO2 with reflections by clouds and other aerosols approximately cancelling absorption by the other gases noted above. Consequently they postulated a positive feedback due to hotter air holding more water vapor, which increased the absorption of radiation and the backwarming. The computer simulations represented this process and many other effects by adjustable parameters chosen to match the observations. As stated on p. 9-9 of IPCC2013, “The complexity of each process representation is constrained by observations, computational resources, and current knowledge.” Models that did not show a temperature rise would have been omitted from any ensemble so the observed rise effectively determined the feedback parameter.
Now that the temperature has stopped increasing we see that this parameter is not valid. It even could be negative. CO2 absorption without the presumed feedback will still happen but its effect will not be alarming. The modest warming possibly could be a net benefit with increased crop production and fewer deaths due to cold weather.
4. THE SUN
The total solar irradiance, the flux integrated over all wavelengths, is a basic input to all climate models. Fortunately our sun is a stable star with minimal change in this output. Since the beginning of satellite measures of the whole spectrum in 1978 the variation has been about 0.1% over the 11-year activity cycle with occasional excursions up to 0.3%. The associated change in tropospheric temperature is about 0.1 ºC.
Larger variations could explain historical warm and cold intervals such as the Medieval Warm Period (approx. 950 – 1250) and the Little Ice Age (approx. 1430 – 1850) but remain as speculations. The sun is a ball of gas in hydrostatic equilibrium. Any reduction in the nuclear energy source initially would be compensated by a gravitational contraction on a time scale of a few minutes. Complicating this basic picture are the variable magnetic field and the mass motions that generate it. Li et al. (2003) included these effects in a simple model and found luminosity variations of 0.1%, consistent with the measurements.
However, the sun can influence the earth in many other ways that the IPCC Report does not consider, in part because the mechanisms are not well understood. The ultraviolet irradiance changes much more with solar activity, ~ 10% at 200 nm in the band that forms ozone in the stratosphere and between 5% and 2% in the ozone absorption bands between 240 and 320 nm according to DeLand & Cebula (2012). Their graphs also show that these fluxes during the most recent solar minimum were lower than the previous two reducing the formation of ozone in the stratosphere and its absorption of the near UV spectrum. How this absorption can couple into the lower atmosphere is under current investigation, e. g. Haigh et al. (2010).

Fig. 3 – Monthly averages of the 10.7 cm solar radio flux measured by the National Research Council of Canada and adjusted to the mean earth-sun distance. A solar flux unit = 104 Jansky = 10-22 Wm-2 Hz-1. The maximum just past is unusually weak and the preceding minimum exceptionally broad. Graph courtesy of Dr. Ken Tapping of NRC.
Decreasing solar activity also lowers the strength of the heliosphere magnetic shield permitting more galactic cosmic rays to reach the earth. Experiments by Kirkby et al. (2011) and Svensmark et al. (2013) have shown that these cosmic rays can seed the formation of clouds, which then reflect more sunlight and reduce the temperature, though the magnitude of the effect remains uncertain. Morton (2014) has described how the abundances cosmogenic isotopes 10Be and 14C in ice cores and tree rings indicate past solar activity and its anticorrelation with temperature.
Of particular interest is the recent reduction in solar activity. Fig. 3 shows the 10.7 cm solar radio flux measured by the National Research Council of Canada since 1947 (Tapping 2013) and Fig. 4 the corresponding sunspot count. Careful calibration of the radio flux permits reliable comparisons

Fig. 4. Monthly sunspot numbers for the past 60 years by the Royal Observatory of Belgium at http://sidc.oma.be/sunspot-index-graphics/sidc_graphics.php.
over six solar cycles even when there are no sunspots. The last minimum was unusually broad and the present maximum exceptionally weak. The sun has entered a phase of low activity. Fig. 5 shows that previous times of very low activity were the Dalton Minimum from about 1800 to 1820 and the Maunder Minimum from about 1645 to 1715 when very few spots were seen. Since these minima occurred during the Little Ice Age when glaciers were advancing in both Northern and Southern Hemispheres, it is possible that we are entering another cooling period. Without a physical understanding of the cause of such cool periods, we cannot be more specific. Temperatures as cold as the Little Ice Age may not happen, but there must be some cooling to compensate the heating that is present from the increasing CO2 absorption.
Regrettably the IPCC reports scarcely mention these solar effects and the uncertainties they add to any prediction.
5. THE AVERAGE GLOBAL TEMPERATURE
Long-term temperature measurements at a given location provide an obvious test of climate change. Such data exist for many places for more than a hundred years and for a few places for much longer. With these data climatologists calculate the temperature anomaly – the deviation from a many-year average such as 1961 to 1990, each day of the year at the times a measurement is recorded. Then they average over days, nights, seasons, continents and oceans to obtain the mean global temperature anomaly for each month or year as in Fig. 1. Unfortunately many parts of the world are poorly sampled and the oceans, which cover 71% of the earth’s surface, even less so. Thus many measurements must be extrapolated to include larger areas with different climates. Corrections are needed when a site’s measurements are interrupted or terminated or a new station is established as well as for urban heat if the meteorological station is in a city and altitude if the station is significantly higher than sea level.

Fig. 5. This plot from the U. S. National Oceanic and Atmospheric Agency shows sunspot numbers since their first observation with telescopes in 1610. Systematic counting began soon after the discovery of the 11-year cycle in 1843. Later searching of old records provided the earlier numbers.
The IPCC Reports refer to four sources of data for the temperature anomaly from the Hadley Centre for Climate Prediction and Research and the European Centre for Medium-range Weather Forcasting in the United Kingdom and the Goddard Institute for Space Science and the National Oceanic and Atmospheric Administration in the United States. For a given month they can differ by several tenths of a degree, but all show the same long-term trends of Fig. 1, a rise from 1978 to 1998 and a plateau from 1998 to the present.
These patterns continue to be a challenge for researchers to understand. Some climatologists like to put a straight line through all the data from 1978 to the present and conclude that the world is continuing to warm, just a little more slowly, but surely if these curves have any connection to reality, changes in slope mean something. Are they evidence of the chaotic nature of climate with abrupt shifts from one state to another?
Essex, McKitrick and Andresen (2007) and Essex and McKitrick (2007) in their popular book have criticized the use of these mean temperature data for the earth. First temperature is an intensive thermodynamic variable relevant to a particular location in equilibrium with the measuring device. Any average with other locations or times of day or seasons has no physical meaning. Other types of averages might be more appropriate such as the second, fourth or inverse power of the absolute temperature, each of which would give a different trend with time. Furthermore it is temperature differences between two places that drive the dynamics. Climatologists have not explained what this single number for global temperature actually means. Essex and McKitrick note that it “is not a temperature. Nor is it even a proper statistic or index. It is a sequence of different statistics grafted together with ad hoc models.”
This questionable use of a global temperature along with the problems of modeling a chaotic system discussed below raise basic concerns about the validity of the test with observations in Section 2. Since climatologists and the IPCC insist on using this temperature number and the models in their predictions of global warming, it still is appropriate to hold them to comparisons with the observations they consider relevant.
6. CHAOS
Essex and McKitrick (2007) have provided a helpful introduction to this problem. Thanks to the pioneering investigations into the equations for convection and the associated turbulence by meteorologist Edward Lorenz, scientists have come to realize that many dynamical systems are fundamentally chaotic. The situation often is described as the butterfly effect because a small change in initial conditions such as the flap of a butterfly wing can have large effects in later results.
Convection and turbulence in the air are central phenomenon in determining weather and so must have their effect on climate too. The IPCC on p. 1-25 of the 2013 Report recognizes this with the statement “There are fundamental limits to just how precisely annual temperatures can be projected, because of the chaotic nature of the climate system.” but then makes predictions with confidence. Meteorologists modeling weather find that their predictions become unstable after a week or two, and they have the advantage of refining their models by comparing predictions with observations.
Why do the climate models in the IPCC reports not show these instabilities? Have they been selectively tuned to avoid them or are the chaotic physical processes not properly included? Why should we think that long-term climate predictions are possible when they are not for weather?
7. THE APPEAL TO CONSENSUS AND THE SILENCING OF SKEPTICISM
Frequently we hear that we must accept that the earth is warming at an alarming rate due to anthropogenic CO2 because 90+% climatologists believe it. However, science is not a consensus discipline. It depends on skeptics questioning every hypothesis, every theory and every model until all rational challenges are satisfied. Any endeavor that must prove itself by appealing to consensus or demeaning skeptics is not science. Why do some proponents of climate alarm dismiss critics by implying they are like Holocaust deniers? Presumably most climatologists disapprove of these unscientific tactics, but too few speak out against them.
8. SUMMARY AND CONCLUSIONS
At least six serious problems confront the climate predictions presented in the last IPCC Report. The models do not predict the observed temperature plateau since 1998, the models adopted a feedback parameter based on the unjustified assumption that the warming prior to 1998 was primarily caused by anthopogenic CO2, the IPCC ignored possible affects of reduced solar activity during the past decade, the temperature anomaly has no physical significance, the models attempt to predict the future of a chaotic system, and there is an appeal to consensus to establish climate science.
Temperatures could start to rise again as we continue to add CO2 to the atmosphere or they could fall as suggested by the present weak solar activity. Many climatologists are trying to address the issues described here to give us a better understanding of the physical processes involved and the reliability of the predictions. One outstanding issue is the location of all the anthropogenic CO2. According to Table 6.1 in the 2013 Report, half goes into the atmosphere and a quarter into the oceans with the remaining quarter assigned to some undefined sequestering as biomass on the land.
Meanwhile what policies should a responsible citizen be advocating? We risk serious consequences from either a major change in climate or an economic recession from efforts to reduce the CO2 output. My personal view is to use this temperature plateau as a time to reassess all the relevant issues. Are there other environmental effects that are equally or more important than global warming? Are some policies like subsidizing biofuels counterproductive? Are large farms of windmills, solar cells or collecting mirrors effective investments when we are unable to store energy? How reliable is the claim that extreme weather events are more frequent because of the global warming? Is it time to admit that we do not understand climate well enough to know how to direct it?
References
DeLand, M. T., & Cebula, R. P. (2012) Solar UV variations during the decline of Cycle 23. J. Atmosph. Solar-Terrestr. Phys., 77, 225.
Essex, C., & McKitrick, R. (2007) Taken by storm: the troubled science, policy and politics of global warming, Key Porter Books. Rev. ed. Toronto, ON, Canada.
Essex, C., McKitrick, R., & Andresen, B. (2007) Does a Global temperature Exist? J. Non-Equilib. Thermodyn. 32, 1.
Haigh. J. D., et al. (2010). An influence of solar spectral variations on radiative forcing of climate. Nature 467, 696.
IPCC (2013), Climate Change 2013: The Physicsal Science Basis. Contribution of Working Group I to the Fifth Assessment Report of the Intergovernmental Panel on Climate Change, http://www.ipcc.ch
Li, L. H., Basu, S., Sofia, S., Robinson, F.J., Demarque, P., & Guenther, D.B. (2003). Global
parameter and helioseismic tests of solar variability models. Astrophys. J., 591, 1284.
Kirkby, J. et al. (2011). Role of sulphuric acid, ammonia and galactic cosmic rays in atmospheric
aerosol nucleation. Nature, 476, 429.
Knight, J., et al. (2009). Bull. Amer. Meteor. Soc., 90 (8), Special Suppl. pp. S22, S23.
Morton, D. C. (2014). An Astronomer’s view of Climate Change. J. Roy. Astron. Soc. Canada, 108, 27. http://arXiv.org/abs/1401.8235.
Svensmark, H., Enghoff, M.B., & Pedersen, J.O.P. (2013). Response of cloud condensation nuclei (> 50 nm) to changes in ion-nucleation. Phys. Lett. A, 377, 2343.
Tapping, K.F. (2013). The 10.7 cm radio flux (F10.7). Space Weather, 11, 394.
Related articles


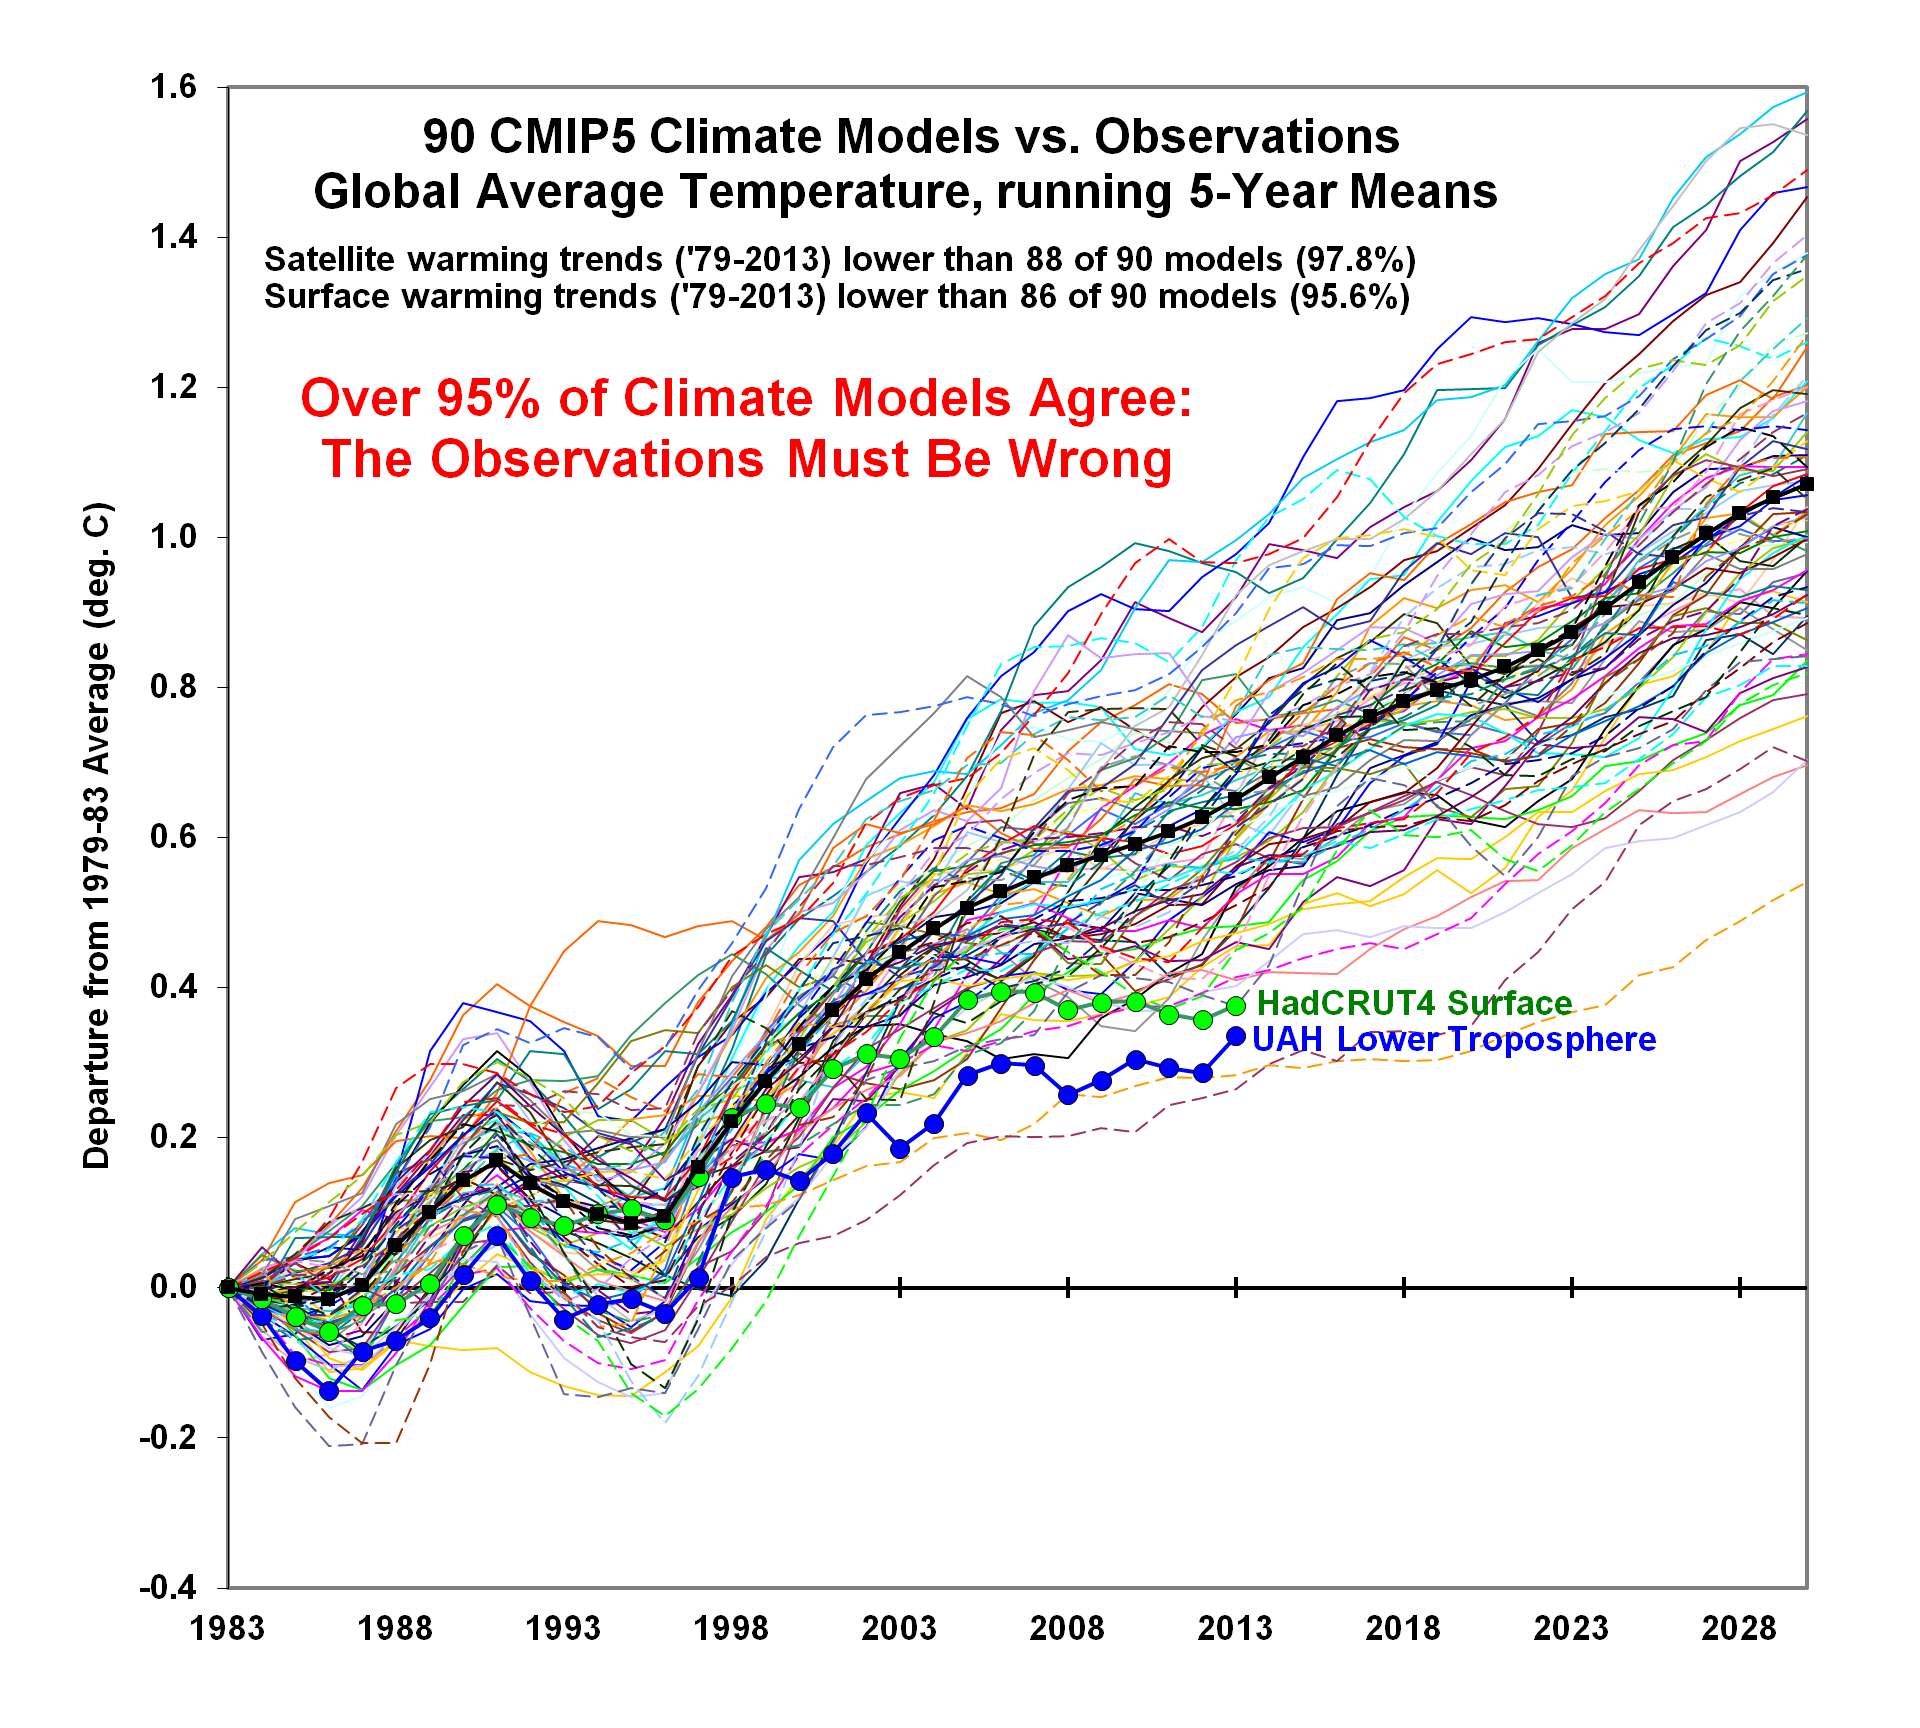
95% of Climate Models Agree: The Observations Must be Wrong
By Roy W. Spencer, Ph. D. | February 7th, 2014
I’m seeing a lot of wrangling over the recent (15+ year) pause in global average warming… when did it start, is it a full pause, shouldn’t we be taking the longer view, etc.
These are all interesting exercises, but they miss the most important point: the climate models that governments base policy decisions on have failed miserably.
I’ve updated our comparison of 90 climate models versus observations for global average surface temperatures through 2013, and we still see that >95% of the models have over-forecast the warming trend since 1979, whether we use their own surface temperature dataset (HadCRUT4), or our satellite dataset of lower tropospheric temperatures (UAH):
Whether humans are the cause of 100% of the observed warming or not, the conclusion is that global warming isn’t as bad as was predicted. That should have major policy implications…assuming policy is still informed by facts more than emotions and political aspirations.
And if humans are the cause of only, say, 50% of the warming (e.g. our published paper), then there is even less reason to force expensive and prosperity-destroying energy policies down our throats.
I am growing weary of the variety of emotional, misleading, and policy-useless statements like “most warming since the 1950s is human caused” or “97% of climate scientists agree humans are contributing to warming”, neither of which leads to the conclusion we need to substantially increase energy prices and freeze and starve more poor people to death for the greater good.
Yet, that is the direction we are heading.
And even if the extra energy is being stored in the deep ocean (if you have faith in long-term measured warming trends of thousandths or hundredths of a degree), I say “great!”. Because that extra heat is in the form of a tiny temperature change spread throughout an unimaginably large heat sink, which can never have an appreciable effect on future surface climate.
If the deep ocean ends up averaging 4.1 deg. C, rather than 4.0 deg. C, it won’t really matter.
~
Roy W. Spencer received his Ph.D. in meteorology at the University of Wisconsin-Madison in 1981. Before becoming a Principal Research Scientist at the University of Alabama in Huntsville in 2001, he was a Senior Scientist for Climate Studies at NASA’s Marshall Space Flight Center, where he and Dr. John Christy received NASA’s Exceptional Scientific Achievement Medal for their global temperature monitoring work with satellites. Dr. Spencer’s work with NASA continues as the U.S. Science Team leader for the Advanced Microwave Scanning Radiometer flying on NASA’s Aqua satellite. He has provided congressional testimony several times on the subject of global warming.
Dr. Spencer’s research has been entirely supported by U.S. government agencies: NASA, NOAA, and DOE. He has never been asked by any oil company to perform any kind of service. Not even Exxon-Mobil.
Dr. Spencer’s first popular book on global warming, Climate Confusion (Encounter Books), is now available at Amazon.com and BarnesAndNoble.com.
Climate Change and the Magnificent Achievements of Eco-Propaganda
By James F. Tracy | Global Research | January 31, 2014
Today a good deal of what qualifies as propaganda is much more subtle than overt. When an entire civilization or way of life is to be significantly altered the tried-and-true method of “repeating a lie until it becomes truth” needs to be done over a period of many years and in a multitude of varying ways to take hold and change the very assumptions and beliefs of a people.
This process is especially vital for reaching a given society’s more elite demographic—the opinion leaders who perceive themselves as “smarter than the average bear” and thus impervious to simple appeals and indoctrination.
A case in point is the agenda backed by powerful global elites and recognizable under names such as “climate change” and “sustainability.” The United Nations Intergovernmental Panel on Climate Change’s Fifth Assessment Report, released on September 27, 2013, came replete with an assemblage of legitimizing features along these lines (“scientific,” “scholarly,” “authoritative,” “peer reviewed,”). Also termed the “Climate Bible,” journalists and policymakers alike regard it as “authoritative” and “the gold standard” of climate science. The public is told that the official body’s findings are now clearer than ever: “human influence has been the dominant cause of the observed warming since the mid-20th century.”[1]
Among the most vociferous agitators for the IPCC’s climate change orthodoxy are the foundation-funded, tax-exempt, progressive-left media that sit alongside the bevy of similarly tax-exempt, foundation-funded environmental organizations that together uphold and publicize the theory of CO2-based anthropogenic (human-caused) climate change (ACC).[2] Self-professed as “independent,” “investigative,” even “educational,” the so-called “alternative media” turn a blind eye to seriously scrutinizing the highly questionable IPCC’s “scientific” review of the climatological literature and its implications for the array of ambitious programs and policies stealthily introduced throughout the industrialized world, many of which are seldom subject to popular plebiscite. Think “smart grid” and “smart growth.”
Logical questions from such apparently independent organs might include, “How does the IPCC produce its findings?” and “Who benefits?” Instead, there is an almost knee-jerk response on behalf of progressive-left editors and readerships to trust and support the UN group’s purportedly objective and meticulous review of the peer-reviewed climatological literature.
Between August and December 2013 such progressive outlets published dozens of articles and commentaries whole-heartedly touting the IPCC report. For example, Truthout.org posted 25 articles, Alternet.org ran 40, MotherJones.com circulated 38, and DemocracyNow.org featured 11.
These were often presented with bleak headlines accenting the urgent appeals found in the IPCC publicity. For example, “International Scientists Warn Climate Deniers Are Enabling Earth’s Suicide” (Truthout, 9/13/13), “6 Scary Conclusions in the UN’s New Climate Report” (Mother Jones, 9/27/13), “Greenhouse Gas in Atmosphere Hits New Record: UN,” (Alternet, 11/1/13), and “’Africa is Being Pushed Closer to the Fire’: Africans Say Continent Can’t Wait for Climate Action” (Democracy Now! 11/22/13).
Uncritical advocacy of the IPCC’s anthropogenic (human-caused) global warming extended beyond headlines to media criticism. In December, for example, the progressive Fairness and Accuracy in Reporting (FAIR) observed that corporate controlled network newscasts routinely failed to link “extreme weather” to “global warming.” “In the first nine months of 2013,” FAIR observes,
there were 450 segments of 200 words or more that covered extreme weather: flooding, forest fires, tornadoes, blizzards, hurricanes and heat waves. But of that total, just a tiny fraction–16 segments, or 4 percent of the total–so much as mentioned the words “climate change,” “global warming” or “greenhouse gases.[3]
What is left unmentioned is that fact that all of these “extreme weather” incidents have one common denominator that FAIR and corporate and progressive media alike consistently overlook: the sun. As University of Winnipeg climatologist Dr. Tim Ball explains (here at 35:00), the IPCC’s “terms of reference” through which the body proceeds to generate its findings exclude the sun and its many demonstrable atmospheric effects as factors in the warming and cooling of the earth’s climate. It is thus no wonder that at best fringe or nonexistent causes of “climate change”–such as minuscule alterations in atmospheric gases–are pointed to with great alarm by the IPCC and its proponents.
Despite far more unambiguous and compelling scientific explanations the notion that “carbon emissions” are the foremost cause of natural climactic events has become something of a religion, and this is especially the case on the progressive-left, where adherents mechanically accept the curious agenda and its ostensibly “scientific” basis while vehemently condemning non-believers as “climate deniers.”
As Canadian journalist Donna LaFramboise has documented in her important 2011 exposé, the IPCC’s scholarly personnel is in fact heavily weighted toward what are often third-or-fourth-rate scientific talent whose eco-political stances are strictly in accord with the IPCC’s “research” agenda pushing anthropogenic climate change. IPCC authors often include climatology graduate students and even environmental activists from organizations such as Greenpeace and the World Wildlife Fund—indeed, figures with little-if-any scientific training but with clear agendas to promote.
LaFramboise further found that one third of the literature reviewed and cited by the IPCC in its 2007 report was–contrary to IPCC chief publicist Ragendra Pachauri’s pronouncements–not even peer-reviewed, and in many cases included citations of promotional literature devised and distributed by environmental activist organizations.
These unethical and compromising relationships are not difficult to explain if one is to recognize the IPCC for what it in fact is—a powerful political organization with the overarching objective of manufacturing consent and achieving transnational policy harmonization around the largely discursive construct of anthropogenic carbon-centric climate change.
The fact that the IPCC is capable of forthrightly carrying out one of the greatest scientific frauds in human history, setting long range governmental policies while enlisting allegedly intellectual sophisticates and “progressive” news media as its most devoted foot soldiers, is no small-scale feat. It is, rather, an immense achievement in modern propaganda and thought control that only hints at the powerful forces behind a much more far-reaching agenda.
Notes
[1] Intergovernmental Panel on Climate Change, “Human Influence on Climate Clear: IPCC Says,” Geneva Switzerland: World Meteorological Organization. The notion of “a 97% consensus” has itself become a common mantra for climate change fear mongering and grounds for labeling someone a “climate denier.” Yet there is limited evidence of any such consensus concerning ACC among climatologists. The oft-cited 2009 American Geophysical Union survey alleging a 98% consensus among scientists on ACC cannot sustain even modest scrutiny. See Larry Bell, “That Scientific Global Warming Consensus … Not!” Forbes.com, July 7, 2012. Another study held up as “proof” of scientific consensus, “Expert Credibility in Climate Change,” asserts only carefully qualified claims along these lines. “A broad analysis of the climate scientist community itself,” the authors point out, “the distribution of credibility of dissenting researchers relative to agreeing researchers, and the level of agreement among top climate experts has not been conducted and would inform future ACC discussions.” The brief paper assesses “an extensive data set of 1,372 climate researchers” to conclude that the scientific expertise and prominence of those who accept the IPCC’s ACC tenets surpass those who remain “unconvinced.” This begs the question, To what degree are the requisites of foundation funding related to espousing IPCC/ACC opinion? William R. L. Anderegg, James W. Prall, Jacob Harold, and Stephen H. Schneider, “Expert Credibility in Climate Change,” Proceedings of the National Academy of Sciences of the United States of America, 2010.
[2] James F. Tracy, “The Forces Behind Carbon-Centric Environmentalism,” Global Research, November 12, 2013.
[3] “TV News and Extreme Weather: Don’t Mention Climate Change,” Fairness and Accuracy in Reporting, December 18, 2013. It might be added that corporate media and progressive-left counterparts uniformly fail to consider other possible causes of such unusual weather events, such as geoengineering and similar “environmental modification techniques” acknowledged by the US military and undertaken in many industrialized countries. See, for example, Michel Chossudovsky, “Climate Change, Geoengineering, and Environmental Modification Techniques,” Global Research, November 24, 2013.
Related articles
Senate EPW Hearing on the President’s Climate Action Plan
By Judith Curry | Climate Etc. | January 16, 2014
The hearing is now concluded, I’m on a plane flying back to Atlanta.
The testimony from each of the witnesses is now online [here]. The link for my testimony is [here].
The content of my verbal remarks is below:
I would like to thank the Committee for the opportunity to present testimony this morning. I am Chair of the School of Earth and Atmospheric Sciences at the Georgia Institute of Technology. I have devoted 30 years to conducting research on topics including climate of the Arctic, the role of clouds and aerosols in the climate system, and the climate dynamics of extreme weather events.
The premise of the President’s Climate Action Plan is that there is an overwhelming judgment of science that anthropogenic global warming is already producing devastating impacts. Anthropogenic greenhouse warming is a theory whose basic mechanism is well understood, but whose magnitude is highly uncertain. Multiple lines of evidence presented in the recent IPCC 5th assessment report suggest that the case for anthropogenic warming is now weaker than in 2007, when the 4th assessment report was published.
My written testimony documented the following evidence:
- For the past 16 years, there has been no significant increase in surface temperature. There is a growing discrepancy between observations and climate model projections. Observations since 2011 have fallen below the 90% envelope of climate model projections
- The IPCC does not have a convincing or confident explanation for this hiatus in warming.
- There is growing evidence of decreased climate sensitivity to atmospheric carbon dioxideconcentrations
- Based on expert judgment in light of this evidence, the IPCC 5th assessment report lowered its surface temperature projection relative to the model projections for the period 2016-2036.
The growing evidence that climate models are too sensitive to CO2 has implications for the attribution of late 20th century warming and projections of 21st century climate change. Sensitivity of the climate to carbon dioxide, and the level of uncertainty in its value, is a key input into the economic models that drive cost-benefit analyses, including estimates of the social cost of carbon.
If the recent warming hiatus is caused by natural variability, then this raises the question as to what extent the warming between 1975 and 2000 can also be explained by natural climate variability. In a recent journal publication, I provided a rationale for projecting that the hiatus in warming could extend to the 2030’s. By contrast, according to climate model projections, the probability of the hiatus extending beyond 20 years is vanishing small. If the hiatus does extend beyond 20 years, then a very substantial reconsideration will be needed of the 20th century attribution and the 21st century projections of climate change.
Attempts to modify the climate through reducing CO2 emissions may turn out to be futile. The stagnation in greenhouse warming observed over the past 15+ years demonstrates that CO2 is not a control knob that can fine tune climate variability on decadal and multi-decadal time scales. Even if CO2 mitigation strategies are successfully implemented and climate model projections are correct, an impact on the climate would not be expected for a number of decades. Further, solar variability, volcanic eruptions and natural internal climate variability will continue to be sources of unpredictable climate surprises.
As a result of the hiatus in warming, there is growing appreciation for the importance of natural climate variability on multi-decadal timescales. Further, the IPCC AR5 and Special Report on Extreme Events published in 2012, find little evidence that supports an increase in most extreme weather events that can be attributed to humans.
The perception that humans are causing an increase in extreme weather events is a primary motivation for the President’s Climate Change Plan. However, in the U.S., most types of weather extremes were worse in the 1930’s and even in the 1950’s than in the current climate, while the weather was overall more benign in the 1970’s. The extremes of the 1930’s and 1950’s are not attributable to greenhouse warming and are associated with natural climate variability (and in the case of the dustbowl drought and heat waves, also to land use practices). This sense that extreme weather events are now more frequent and intense is symptomatic of pre-1970 ‘weather amnesia’.
The frequency and intensity of extreme weather events is heavily influenced by natural climate variability. Whether or not anthropogenic climate change is exacerbating extreme weather events, vulnerability to extreme weather events will continue to increase owing to increasing population and concentration of wealth in vulnerable regions. Regions that find solutions to current problems of climate variability and extreme weather events and address challenges associated with an increasing population are likely to be well prepared to cope with any additional stresses from climate change.
Nevertheless, the premise of dangerous anthropogenic climate change is the foundation for a far-reaching plan to reduce greenhouse gas emissions and reduce vulnerability to extreme weather events. Elements of this Plan may be argued as important for associated energy policy reasons, economics, and/or public health and safety. However, claiming an overwhelming scientific justification for the Plan based upon anthropogenic global warming does a disservice both to climate science and to the policy process.
Good judgment requires recognizing that climate change is characterized by conditions of deep uncertainty. Robust policy options that can be justified by associated policy reasons whether or not anthropogenic climate change is dangerous avoids the hubris of pretending to know what will happen with the 21st century climate.
This concludes my testimony.
JC comments: The hearing was very long; not so much because of questioning of the witnesses, but there was much pontification by the committee members (much more of this than on the House Subcommittees, it seems).
Several things struck me. All of the members seem pretty well educated on the topic of climate change. I cannot say the same of the administrators on the first panel.
Most of the members were there for Panel 1; only a few remained for Panel 2.
I’m fairly happy with my written testimony, but was surprised that my verbal testimony went over the time limit (have never gone over before). The questions were fairly light weight.
Andrew Dessler did a pretty good job particularly on the verbal testimony and answering questions.
All in all, a very interesting experience, but stressful since you need to pretty much drop everything to prepare your testimony (and I have a pile of things that need to be finished before tomorrow).
So does any of this matter? We’ll see. I felt that my previous testimony to the House Committee did have an impact.
Featured Video

Netanyahu Ordered the 2003 Invasion of Iraq
or go to
Aletho News Archives – Video-Images
From the Archives
Hitler, Churchill, the Holocaust, and the War in Ukraine
Mike Whitney Interview with Ron Unz • Unz Review • July 17, 2023
Question 1: Hitler
In the West, we’re taught that Hitler is the embodiment of all evil, but it’s more complicated than that, isn’t it? The more I read about Hitler, the more convinced I am that his views about the Versailles Treaty were fairly commonplace among Germans living at the time. It seems to me that if Hitler hadn’t emerged as the leader who promised to restore Germany (to its original borders), someone else would have taken his place. The real problem was the injustice of the treaty itself which exacted reparations that could not be repaid along with the partitioning of the German state. It was the onerous settlement of Versailles that ensured there would be Second World War not Hitler.
Am I wrong about this? And would you agree that our over-simplified “cartoonish” portrayal of Hitler prevents people from understanding the events that led to WW2?
Ron Unz—You’re correct on all those points, but the true history is even worse than that. … continue
Blog Roll
 Aletho News
- The Second Circuit Again Violated the Rights of the Amish
- Ukraine using mobilization threat to pressure journalists – media
- Chad announces withdrawal from International Criminal Court Treaty
- Netanyahu will reject US demands for withdrawal from Lebanon, Gaza, Syria if asked: Report
- Russia warns Ukraine expanding ‘terrorist activities’ beyond Europe
- US use of Italian military bases in the conflict with Iran shows lack of autonomy
- The synthesis of regional conflicts into WWIII has begun
- Is the Department of War Covering Up the True Extent of US Casualties?
- Is Peter Mandelson a Russian or a Zionist asset?
- German arms exports to Israel surge sharply amid Gaza genocide
- If Americans Knew
- ‘Hell on Earth’: Roger Waters on Palestine, Apartheid and the Cost of Speaking Out
- ISRAELI MEDIA: Israelis Fight Over Framing of West Bank Attacks. But Settler Violence Is an Israeli Strategy (2 articles)
- Attacks on Mamdani Prove Israel’s Supporters Can’t Even Tolerate Criticism of Netanyahu
- Integrated Israeli Policies Fast‑Track Israeli Annexation of Palestinian Land
- ICC Chief Prosecutor Karim Khan dared to hold Israel to account – that’s why he was brought down
- Why did Bari Weiss fire Cecilia Vargas?
- Rescue teams recover remains of 99 Palestinians from one home in Gaza – Daily Update
- Patrick Bet-David sells wealth building, but the real product is Zionist shilling
- The Last-Minute Million-Dollar Ad Spend Against Will Lawrence Is Coming From a Major Pro-Israel Group
- Five decades of Israeli covert strategy to push US, Iran into confrontation
- No Tricks Zone
- ECMWF Models Throwing Cold Water On Extreme Germany Heat Wave Forecast Next Week
- Greenland’s Ice Sheet Was Supposed To Be Rapidly Melting Away. It Hasn’t Been.
- Global Temperature Trend Has Cooled Over The Past 6500 Years, Scientists Have Found
- Wind Energy Means Going Back To The Middle Ages, Says German Professor Horst-Joachim Lüdecke
- New Study: A 40-Fold Increase In Earth’s Main Greenhouse Gas Contributes To Cooling The Ocean
- New Study Highlights The ‘Dominant Role’ Of Aerosol/Cloud Interactions In Shaping Climate
- Munich’s First-Ever Green Party Mayor Declares First Ever City Water Use Restrictions… Fines Up to 50,000 €!
- Experimental Lab Research: The Climate Sensitivity To A 400-Fold Increase In CO2 Is 0.1°C
- Fatal Snobbery: In France, It’s Better To Die From A Heatwave Than To Do As Americans
- New Study: NASA’s Models Wildly Underestimate The Capacity Of Clouds To Alter Solar Radiation
