Climate scientists versus climate data
By John Bates | Climate Etc. | February 4, 2017
A look behind the curtain at NOAA’s climate data center.
I read with great irony recently that scientists are “frantically copying U.S. Climate data, fearing it might vanish under Trump” (e.g., Washington Post 13 December 2016). As a climate scientist formerly responsible for NOAA’s climate archive, the most critical issue in archival of climate data is actually scientists who are unwilling to formally archive and document their data. I spent the last decade cajoling climate scientists to archive their data and fully document the datasets. I established a climate data records program that was awarded a U.S. Department of Commerce Gold Medal in 2014 for visionary work in the acquisition, production, and preservation of climate data records (CDRs), which accurately describe the Earth’s changing environment.
The most serious example of a climate scientist not archiving or documenting a critical climate dataset was the study of Tom Karl et al. 2015 (hereafter referred to as the Karl study or K15), purporting to show no ‘hiatus’ in global warming in the 2000s (Federal scientists say there never was any global warming “pause”). The study drew criticism from other climate scientists, who disagreed with K15’s conclusion about the ‘hiatus.’ (Making sense of the early-2000s warming slowdown). The paper also drew the attention of the Chairman of the House Science Committee, Representative Lamar Smith, who questioned the timing of the report, which was issued just prior to the Obama Administration’s Clean Power Plan submission to the Paris Climate Conference in 2015.
In the following sections, I provide the details of how Mr. Karl failed to disclose critical information to NOAA, Science Magazine, and Chairman Smith regarding the datasets used in K15. I have extensive documentation that provides independent verification of the story below. I also provide my suggestions for how we might keep such a flagrant manipulation of scientific integrity guidelines and scientific publication standards from happening in the future. Finally, I provide some links to examples of what well documented CDRs look like that readers might contrast and compare with what Mr. Karl has provided.
Background
In 2013, prior to the Karl study, the National Climatic Data Center [NCDC, now the NOAA National Centers for Environmental Information (NCEI)] had just adopted much improved processes for formal review of Climate Data Records, a process I formulated [link]. The land temperature dataset used in the Karl study had never been processed through the station adjustment software before, which led me to believe something was amiss. When I pressed the co-authors, they said they had decided not to archive the dataset, but did not defend the decision. One of the co-authors said there were ‘some decisions [he was] not happy with’. The data used in the K15 paper were only made available through a web site, not in digital form, and lacking proper versioning and any notice that they were research and not operational data. I was dumbstruck that Tom Karl, the NCEI Director in charge of NOAA’s climate data archive, would not follow the policy of his own Agency nor the guidelines in Science magazine for dataset archival and documentation.
I questioned another co-author about why they choose to use a 90% confidence threshold for evaluating the statistical significance of surface temperature trends, instead of the standard for significance of 95% — he also expressed reluctance and did not defend the decision. A NOAA NCEI supervisor remarked how it was eye-opening to watch Karl work the co-authors, mostly subtly but sometimes not, pushing choices to emphasize warming. Gradually, in the months after K15 came out, the evidence kept mounting that Tom Karl constantly had his ‘thumb on the scale’—in the documentation, scientific choices, and release of datasets—in an effort to discredit the notion of a global warming hiatus and rush to time the publication of the paper to influence national and international deliberations on climate policy.
Defining an Operational Climate Data Record
For nearly two decades, I’ve advocated that if climate datasets are to be used in important policy decisions, they must be fully documented, subject to software engineering management and improvement processes, and be discoverable and accessible to the public with rigorous information preservation standards. I was able to implement such policies, with the help of many colleagues, through the NOAA Climate Data Record policies (CDR) [link].
Once the CDR program was funded, beginning in 2007, I was able to put together a team and pursue my goals of operational processing of important climate data records emphasizing the processes required to transition research datasets into operations (known as R2O). Figure 1 summarizes the steps required to accomplish this transition in the key elements of software code, documentation, and data.
 Figure 1. Research to operations transition process methodology from Bates et al. 2016.
Unfortunately, the NCDC/NCEI surface temperature processing group was split on whether to adopt this process, with scientist Dr. Thomas C. Peterson (a co-author on K15, now retired from NOAA) vigorously opposing it. Tom Karl never required the surface temperature group to use the rigor of the CDR methodology, although a document was prepared identifying what parts of the surface temperature processing had to be improved to qualify as an operational CDR.
Tom Karl liked the maturity matrix so much, he modified the matrix categories so that he could claim a number of NCEI products were “Examples of “Gold” standard NCEI Products (Data Set Maturity Matrix Model Level 6).” See his NCEI overview presentation all NCEI employees [ncei-overview-2015nov-2 ] were told to use, even though there had never been any maturity assessment of any of the products.
NCDC/NCEI surface temperature processing and archival
In the fall of 2012, the monthly temperature products issued by NCDC were incorrect for 3 months in a row [link]. As a result, the press releases and datasets had to be withdrawn and reissued. Dr. Mary Kicza, then the NESDIS Associate Administrator (the parent organization of NCDC/NCEI in NOAA), noted that these repeated errors reflected poorly on NOAA and required NCDC/NCEI to improve its software management processes so that such mistakes would be minimized in the future. Over the next several years, NCDC/NCEI had an incident report conducted to trace these errors and recommend corrective actions.
Following those and other recommendations, NCDN/NCEI began to implement new software management and process management procedures, adopting some of the elements of the CDR R2O process. In 2014 a NCDC/NCEI Science Council was formed to review new science activities and to review and approve new science products for operational release. A draft operational readiness review (ORR) was prepared and used for approval of all operational product releases, which was finalized and formally adopted in January 2015. Along with this process, a contractor who had worked at the CMMI Institute (CMMI, Capability Maturity Model Integration, is a software engineering process level improvement training and appraisal program) was hired to improve software processes, with a focus on improvement and code rejuvenation of the surface temperature processing code, in particular the GHCN-M dataset.
The first NCDC/NCEI surface temperature software to be put through this rejuvenation was the pairwise homogeneity adjustment portion of processing for the GHCN-Mv4 beta release of October 2015. The incident report had found that there were unidentified coding errors in the GHCN-M processing that caused unpredictable results and different results every time code was run.
The generic flow of data used in processing of the NCDC/NCEI global temperature product suite is shown schematically in Figure 2. There are three steps to the processing, and two of the three steps are done separately for the ocean versus land data. Step 1 is the compilation of observations either from ocean sources or land stations. Step 2 involves applying various adjustments to the data, including bias adjustments, and provides as output the adjusted and unadjusted data on a standard grid. Step 3 involves application of a spatial analysis technique (empirical orthogonal teleconnections, EOTs) to merge and smooth the ocean and land surface temperature fields and provide these merged fields as anomaly fields for ocean, land and global temperatures. This is the product used in K15. Rigorous ORR for each of these steps in the global temperature processing began at NCDC in early 2014. Figure 2. Generic data flow for NCDC/NCEI surface temperature products.
In K15, the authors describe that the land surface air temperature dataset included the GHCN-M station data and also the new ISTI (Integrated Surface Temperature Initiative) data that was run through the then operational GHCN-M bias correction and gridding program (i.e., Step 2 of land air temperature processing in Figure 2). They further indicated that this processing and subsequent corrections were ‘essentially the same as those used in GHCN-Monthly version 3’. This may have been the case; however, doing so failed to follow the process that had been initiated to ensure the quality and integrity of datasets at NCDC/NCEI.
The GHCN-M V4 beta was put through an ORR in October 2015; the presentation made it clear that any GHCN-M version using the ISTI dataset should, and would, be called version 4. This is confirmed by parsing the file name actually used on the FTP site for the K15 dataset [link]; NOTE: placing a non-machine readable copy of a dataset on an FTP site does not constitute archiving a dataset). One file is named ‘box.12.adj.4.a.1.20150119’, where ‘adj’ indicates adjusted (passed through step 2 of the land processing) and ‘4.a.1’ means version 4 alpha run 1; the entire name indicating GHCN-M version 4a run 1. That is, the folks who did the processing for K15 and saved the file actually used the correct naming and versioning, but K15 did not disclose this. Clearly labeling the dataset would have indicated this was a highly experimental early GHCN-M version 4 run rather than a routine, operational update. As such, according to NOAA scientific integrity guidelines, it would have required a disclaimer not to use the dataset for routine monitoring.
In August 2014, in response to the continuing software problems with GHCNMv3.2.2 (version of August 2013), the NCDC Science Council was briefed about a proposal to subject the GHCNMv3 software, and particularly the pairwise homogeneity analysis portion, to a rigorous software rejuvenation effort to bring it up to CMMI level 2 standards and resolve the lingering software errors. All software has errors and it is not surprising there were some, but the magnitude of the problem was significant and a rigorous process of software improvement like the one proposed was needed. However, this effort was just beginning when the K15 paper was submitted, and so K15 must have used date with some experimental processing that combined aspects of V3 and V4 with known flaws. The GHCNMv3.X used in K15 did not go through any ORR process, and so what precisely was done is not documented. The ORR package for GHCNMv4 beta (in October 2015) uses the rejuvenated software and also includes two additional quality checks versus version 3.
Which version of the GHCN-M software K15 used is further confounded by the fact that GHCNMv3.3.0, the upgrade from version 3.2.2, only went through an ORR in April 2015 (i.e., after the K15 paper was submitted and revised). The GHCN-Mv3.3.0 ORR presentation demonstrated that the GHCN-M version changes between V3.2.2 and V3.3.0 had impacts on rankings of warmest years and trends. The data flow that was operational in June 2015 is shown in figure 3.
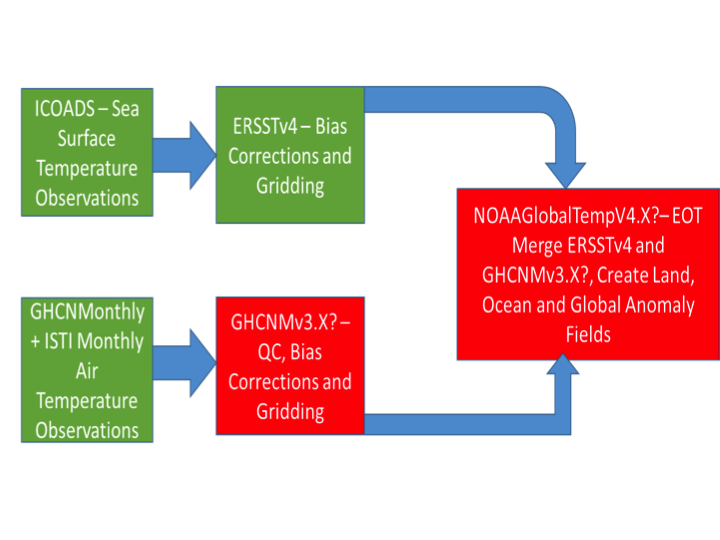 Figure 3. Data flow for surface temperature products described in K15 Science paper. Green indicates operational datasets having passed ORR and archived at time of publication. Red indicates experimental datasets never subject to ORR and never archived.
It is clear that the actual nearly-operational release of GHCN-Mv4 beta is significantly different from the version GHCNM3.X used in K15. Since the version GHCNM3.X never went through any ORR, the resulting dataset was also never archived, and it is virtually impossible to replicate the result in K15.
At the time of the publication of the K15, the final step in processing the NOAAGlobalTempV4 had been approved through an ORR, but not in the K15 configuration. It is significant that the current operational version of NOAAGlobalTempV4 uses GHCN-M V3.3.0 and does not include the ISTI dataset used in the Science paper. The K15 global merged dataset is also not archived nor is it available in machine-readable form. This is why the two boxes in figure 3 are colored red.
The lack of archival of the GHCN-M V3.X and the global merged product is also in violation of Science policy on making data available [link]. This policy states: “Climate data. Data should be archived in the NOAA climate repository or other public databases”. Did Karl et al. disclose to Science Magazine that they would not be following the NOAA archive policy, would not archive the data, and would only provide access to a non-machine readable version only on an FTP server?
For ocean temperatures, the ERSST version 4 is used in the K15 paper and represents a major update from the previous version. The bias correction procedure was changed and this resulted in different SST anomalies and different trends during the last 15+ years relative to ERSST version 3. ERSSTV4 beta, a pre-operational release, was briefed to the NCDC Science Council and approved on 30 September 2014.
The ORR for ERSSTV4, the operational release, took place in the NCDC Science Council on 15 January 2015. The ORR focused on process and questions about some of the controversial scientific choices made in the production of that dataset will be discussed in a separate post. The review went well and there was only one point of discussion on process. One slide in the presentation indicated that operational release was to be delayed to coincide with Karl et al. 2015 Science paper release. Several Science Council members objected to this, noting the K15 paper did not contain any further methodological information—all of that had already been published and thus there was no rationale to delay the dataset release. After discussion, the Science Council voted to approve the ERSSTv4 ORR and recommend immediate release.
The Science Council reported this recommendation to the NCDC Executive Council, the highest NCDC management board. In the NCDC Executive Council meeting, Tom Karl did not approve the release of ERSSTv4, noting that he wanted its release to coincide with the release of the next version of GHCNM (GHCNMv3.3.0) and NOAAGlobalTemp. Those products each went through an ORR at NCDC Science Council on 9 April 2015, and were used in operations in May. The ERSSTv4 dataset, however, was still not released. NCEI used these new analyses, including ERSSTv4, in its operational global analysis even though it was not being operationally archived. The operational version of ERSSTv4 was only released to the public following publication of the K15 paper. The withholding of the operational version of this important update came in the middle of a major ENSO event, thereby depriving the public of an important source of updated information, apparently for the sole purpose of Mr. Karl using the data in his paper before making the data available to the public.
So, in every aspect of the preparation and release of the datasets leading into K15, we find Tom Karl’s thumb on the scale pushing for, and often insisting on, decisions that maximize warming and minimize documentation. I finally decided to document what I had found using the climate data record maturity matrix approach. I did this and sent my concerns to the NCEI Science Council in early February 2016 and asked to be added to the agenda of an upcoming meeting. I was asked to turn my concerns into a more general presentation on requirements for publishing and archiving. Some on the Science Council, particularly the younger scientists, indicated they had not known of the Science requirement to archive data and were not aware of the open data movement. They promised to begin an archive request for the K15 datasets that were not archived; however I have not been able to confirm they have been archived. I later learned that the computer used to process the software had suffered a complete failure, leading to a tongue-in-cheek joke by some who had worked on it that the failure was deliberate to ensure the result could never be replicated.
Where do we go from here?
I have wrestled for a long time about what to do about this incident. I finally decided that there needs to be systemic change both in the operation of government data centers and in scientific publishing, and I have decided to become an advocate for such change. First, Congress should re-introduce and pass the OPEN Government Data Act. The Act states that federal datasets must be archived and made available in machine readable form, neither of which was done by K15. The Act was introduced in the last Congress and the Senate passed it unanimously in the lame duck session, but the House did not. This bodes well for re-introduction and passage in the new Congress.
However, the Act will be toothless without an enforcement mechanism. For that, there should be mandatory, independent certification of federal data centers. As I noted, the scientists working in the trenches would actually welcome this, as the problem has been one of upper management taking advantage of their position to thwart the existing executive orders and a lack of process adopted within Agencies at the upper levels. Only an independent, outside body can provide the needed oversight to ensure Agencies comply with the OPEN Government Data Act.
Similarly, scientific publishers have formed the Coalition on Publishing Data in the Earth and Space Sciences (COPDESS) with a signed statement of commitment to ensure open and documented datasets are part of the publication process. Unfortunately, they, too, lack any standard checklist that peer reviewers and editors can use to ensure the statement of commitment is actually enforced. In this case, and for assessing archives, I would advocate a metric such as the data maturity model that I and colleagues have developed. This model has now been adopted and adapted by several different groups, applied to hundreds of datasets across the geophysical sciences, and has been found useful for ensuring information preservation, discovery, and accessibility.
Finally, there needs to be a renewed effort by scientists and scientific societies to provide training and conduct more meetings on ethics. Ethics needs to be a regular topic at major scientific meetings, in graduate classrooms, and in continuing professional education. Respectful discussion of different points of view should be encouraged. Fortunately, there is initial progress to report here, as scientific societies are now coming to grips with the need for discussion of and guidelines for scientific ethics.
There is much to do in each of these areas. Although I have retired from the federal government, I have not retired from being a scientist. I now have the luxury of spending more time on these things that I am most passionate about. I also appreciate the opportunity to contribute to Climate Etc. and work with my colleague and friend Judy on these important issues.
Postlude
A couple of examples of how the public can find and use CDR operational products, and what is lacking in a non-operational and non-archived product
- NOAA CDR of total solar irradiance – this is the highest level quality. Start at web site – https://data.nodc.noaa.gov/cgi-bin/iso?id=gov.noaa.ncdc:C00828
Here you will see a fully documented CDR. At the top, we have the general description and how to cite the data. Then below, you have a set of tabs with extensive information. Click each tab to see how it’s done. Note, for example, that in ‘documentation’ you have choices to get the general documentation, processing documents including source code, data flow diagram, and the algorithm theoretical basis document ATBD which includes all the info about how the product is generated, and then associated resources. This also includes a permanent digital object identifier (doi) to point uniquely to this dataset.
- NOAA CDR of mean layer temperature – RSS – one generation behind in documentation but still quite good – https://www.ncdc.noaa.gov/cdr/fundamental/mean-layer-temperature-rss
Here on the left you will find the documents again that are required to pass the CDR operations and archival. Even though it’s a slight cut below TSI in example 1, a user has all they need to use and understand this.
- The Karl hiatus paper can be found on NCEI here – https://www.ncdc.noaa.gov/news/recent-global-surface-warming-hiatus
If you follow the quick link ‘Download the Data via FTP’ you go here – ftp://ftp.ncdc.noaa.gov/pub/data/scpub201506/
The contents of this FTP site were entered into the NCEI archive following my complaint to the NCEI Science Council. However, the artifacts for full archival of an operational CDR are not included, so this is not compliant with archival standards.
Biosketch:
John Bates received his Ph.D. in Meteorology from the University of Wisconsin-Madison in 1986. Post Ph.D., he spent his entire career at NOAA, until his retirement in 2016. He spent the last 14 years of his career at NOAA’s National Climatic Data Center (now NCEI) as a Principal Scientist, where he served as a Supervisory Meteorologist until 2012.
Dr. Bates’ technical expertise lies in atmospheric sciences, and his interests include satellite observations of the global water and energy cycle, air-sea interactions, and climate variability. His most highly cited papers are in observational studies of long term variability and trends in atmospheric water vapor and clouds.
NOAA Administrator’s Award 2004 for “outstanding administration and leadership in developing a new division to meet the challenges to NOAA in the area of climate applications related to remotely sensed data”. He was awarded a U.S. Department of Commerce Gold Medal in 2014 for visionary work in the acquisition, production, and preservation of climate data records (CDRs). He has held elected positions at the American Geophysical Union (AGU), including Member of the AGU Council and Member of the AGU Board. He has played a leadership role in data management for the AGU.
He is currently President of John Bates Consulting Inc., which puts his recent experience and leadership in data management to use in helping clients improve data management to improve their preservation, discovery, and exploitation of their and others data. He has developed and applied techniques for assessing both organizational and individual data management and applications. These techniques help identify how data can be managed more cost effectively and discovered and applied by more users.
David Rose in the Mail on Sunday
David Rose of the UK Mail on Sunday is working on a comprehensive expose of this issue [link].
Here are the comments that I provided to David Rose, some of which were included in his article:
Here is what I think the broader implications are. Following ClimateGate, I made a public plea for greater transparency in climate data sets, including documentation. In the U.S., John Bates has led the charge in developing these data standards and implementing them. So it is very disturbing to see the institution that is the main U.S. custodian of climate data treat this issue so cavalierly, violating its own policy. The other concern that I raised following ClimateGate was overconfidence and inadequate assessments of uncertainty. Large adjustments to the raw data, and substantial changes in successive data set versions, imply substantial uncertainties. The magnitude of these uncertainties influences how we interpret observed temperature trends, ‘warmest year’ claims, and how we interpret differences between observations and climate model simulations. I also raised concerns about bias; here we apparently see Tom Karl’s thumb on the scale in terms of the methodologies and procedures used in this publication.
Apart from the above issues, how much difference do these issues make to our overall understanding of global temperature change? All of the global surface temperature data sets employ NOAA’s GHCN land surface temperatures. The NASA GISS data set also employs the ERSST datasets for ocean surface temperatures. There are global surface temperature datasets, such as Berkeley Earth and HadCRUT that are relatively independent of the NOAA data sets, that agree qualitatively with the new NOAA data set. However, there remain large, unexplained regional discrepancies between the NOAA land surface temperatures and the raw data. Further, there are some very large uncertainties in ocean sea surface temperatures, even in recent decades. Efforts by the global numerical weather prediction centers to produce global reanalyses such as the European Copernicus effort is probably the best way forward for the most recent decades.
Regarding uncertainty, ‘warmest year’, etc. there is a good article in the WSJ : Change would be healthy at U.S. climate agencies (hockeyshtick has reproduced the full article).
I also found this recent essay in phys.org to be very germane: Certainty in complex scientific research an unachievable goal. Researchers do a good job of estimating the size of errors in measurements but underestimate chance of large errors.
Backstory
I have known John Bates for about 25 years, and he served on the Ph.D. committees of two of my graduate students. There is no one, anywhere, that is a greater champion for data integrity and transparency.
When I started Climate Etc., John was one of the few climate scientists that contacted me, sharing concerns about various ethical issues in our field.
Shortly after publication of K15, John and I began discussing our concerns about the paper. I encouraged him to come forward publicly with his concerns. Instead, he opted to try to work within the NOAA system to address the issues –to little effect. Upon his retirement from NOAA in November 2016, he decided to go public with his concerns.
He submitted an earlier, shorter version of this essay to the Washington Post, in response to the 13 December article (climate scientists frantically copying data). The WaPo rejected his op-ed, so he decided to publish at Climate Etc.
In the meantime, David Rose contacted me about a month ago, saying he would be in Atlanta covering a story about a person unjustly imprisoned [link]. He had an extra day in Atlanta, and wanted to get together. I told him I wasn’t in Atlanta, but put him in contact with John Bates. David Rose and his editor were excited about what John had to say.
I have to wonder how this would have played out if we had issued a press release in the U.S., or if this story was given to pretty much any U.S. journalist working for the mainstream media. Under the Obama administration, I suspect that it would have been very difficult for this story to get any traction. Under the Trump administration, I have every confidence that this will be investigated (but still not sure how the MSM will react).
Well, it will be interesting to see how this story evolves, and most importantly, what policies can be put in place to prevent something like this from happening again.
I will have another post on this topic in a few days.
Being retired sure is liberating . . .
There’s Nothing Parochial About the Issue of GMO Food Labeling
By Jonathan Latham, PhD | Independent Science News | January 24, 2017
The GMO labeling issue has quieted down some but there is still plenty to discuss. Just this week the USDA proposed its definition of a GMO for labeling purposes and it includes loopholes for gene editing. However, it is also possible for reasonable people to imagine that GMO labeling is a sideshow to the real business of the food movement. After all, most GMO foods and GMO crops are visually indistinguishable from non-GMOs, and tiny non-GMO labels can look pretty irrelevant on the side of a soda bottle containing whole cupfuls of sugar. Last week, Michael Pollan, Olivier de Schutter, Mark Bittman and Ricardo Salvador made that error, calling GMO labeling “parochial.” Granted, they wrote “important but parochial”, but qualifying the significance of GMO labeling in any way was a mistake.
The first issue is that GMOs are legally distinct from non-GMO crop varieties. They possess an enhanced legal status that has enabled GMOs to become a gushing profit centre for agribusiness. These rights not only allow their owners to steer farmers’ herbicide use, which also increases profits, they can also legally prevent independent research which would otherwise show up their advertising claims. The share price of Monsanto reached $142 in 2008, reflecting the enormous profitability of massively increasing seed prices on the back of GMO introductions.

California Proposition 37
Those profits have in turn fuelled a set of key agribusiness activities. One was the acquisition of almost the entire independent global seed business, which now resides in very few hands. The second was a cluster of enhanced PR and lobbying activities that were necessary to defend GMOs. Rather than hide in the shadows agribusiness corporations needed to come out swinging in defence of the indefensible, which necessitated, among other things, a much higher degree of control than previously over teaching content and research at public universities.
Thus their special legal status enabled an unprecedented ability to control both the present and the future of agriculture.
GMOs are also conflated with science and thus progress. They have the intellectual role of presenting agribusiness as the innovative and dynamic frontier of agriculture, in contrast to those people who base their efforts on ecological diversity, local expertise, or deep knowledge. This cutting edge image is key to the agribusiness business model of reaping tax breaks and subsidies (Lima, 2015).
All around the world, taxpayer money supports and subsidises agribusiness without which benefits it would not exist (Capellesso et al., 2016). In the final analysis, however, the GMOs-as-progress argument is circular. Agribusiness is innovative because it uses GMOs and GMOs show how innovative they are. Smoke and mirrors, but politicians fall for it every day, delivering massive transfers of wealth every year from the public to the private sector (Lima, 2015).
The biological truth of GMOs is equally disturbing. At one end of the food chain are the crops in the field. Many people have noticed the virtual disappearance of Monarch butterflies. There are three leading explanations of this disappearance. The loss from farmland of their larval host plants, milkweeds, is one possibility; poisoning of their caterpillar larvae after consuming insecticide-filled pollen from Bt insect-resistant GMOs is a second; and toxicity from the neonicotinoid pesticides used to treat GMO seeds is the third. The first two both stem directly or indirectly from GMO use in agricultural fields since before GMOs, milkweeds could not be eradicated and now they can. Most likely is that all three causes are true and that along with milkweeds GMO agriculture also decimated, or eradicated entirely, many other species too.
Monarchs are lovely, but they are not otherwise special. Their significance is as sentinels. Planting milkweeds and pollinator way stations to specially preserve a sentinel species does not rescue an agricultural ecosystem, but it will mask the symptoms. Agribusiness is right now hoping that no one will notice the difference, and that by bringing back monarchs it can obscure the facts of their killing fields.
Internationally too, GMOs threaten to transform agriculture in places like India where millions of people who make a living by labouring in fields could be displaced by herbicide-tolerant crops such as mustard.
At the human consumption end of the food chain, if you live in the US, no one is protecting you from potential health hazards due to GMOs. Makers of GMO crop varieties don’t even have to notify the FDA of a new product. And if the maker deems the product is not a pesticide they don’t have to notify the EPA either. Trump won’t make it worse because it can’t be worse. It is non-partisan contempt for public health.
What are those potential health hazards? One important example is the famous (or infamous) rat study of NK603 corn by the French research group of professor Gilles-Eric Séralini . It is the only longterm study of the effects of GMOs on a mammal. If you ignore the tumours that most people focused on, the study found major kidney and liver dysfunction in the treated animals (Séralini et al., 2014). This dysfunction was evident from biochemical measurements and was also visually apparent under the microscope. These results are of no interest to US regulators, even in principle, since they fall between jurisdictions.
From this we can conclude that GMOs are often harmful, directly and indirectly, and further, that they are the leading edge of the business model of agribusiness.
The question, however, was labeling. Imagine that organic food was not allowed to be labeled. Would there be such an organised and powerful challenge to industrial food? What labeling does for the agriculture and food system is to allow the public to express its dismay and disagreement with the direction of corporate agriculture and assert their democratic rights to protect themselves. Labeling allows the public to engage with specific policies and products within the vast complexity of the food system and push back in a focused way against corruption and dishonesty, in real time. There aren’t too many chances to do that in America today.
References
Capellesso AJ, Ademir Antonio Cazella, Abdon Luiz Schmitt Filho, Joshua Farley, and Diego Albino Martins (2016) Economic and environmental impacts of production intensification in agriculture: comparing transgenic, conventional, and agroecological maize crops. AGROECOLOGY AND SUSTAINABLE FOOD SYSTEMS 40: 215–236. Lima T. (2015) Agricultural Subsidies for Non-farm Interests: An Analysis of the US Agro-industrial Complex. Agrarian South: Journal of Political Economy 4(1) 54–84o-industrial Complex
Séralini G-E, Emilie Clair, Robin Mesnage, Steeve Gress, Nicolas Defarge, Manuela Malatesta, Didier Hennequin and Joël Spiroux de Vendômois (2014) Republished study: long-term toxicity of a Roundup herbicide and a Roundup-tolerantgenetically modified maize. Environmental Sciences Europe 26:14 DOI: 10.1186/s12302-014-0014-5
NOAA’s Tornado Fraud
By Paul Homewood | Not A Lot Of People Know That | January 15, 2017
https://www.ncdc.noaa.gov/sotc/tornadoes/201613
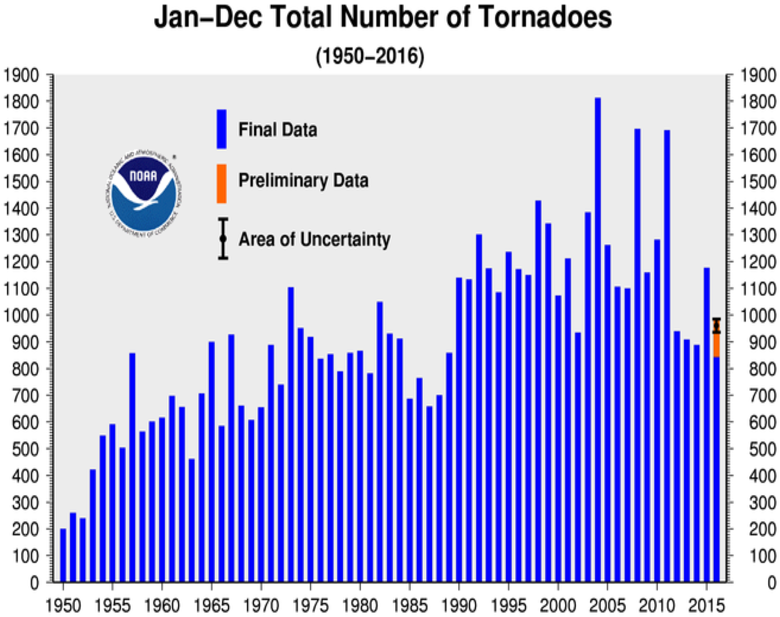
According to NOAA, the number of tornadoes has been steadily growing since the 1950s, despite a drop in numbers in the last five years.
They show the above chart prominently in their Tornadoes – Annual 2016 Report.
However, they know full well that it is meaningless to compare current data with the past, as they explain themselves in the section Historical Records and Trends, which is hidden away on their own website:
One of the main difficulties with tornado records is that a tornado, or evidence of a tornado must have been observed. Unlike rainfall or temperature, which may be measured by a fixed instrument, tornadoes are short-lived and very unpredictable. If a tornado occurs in a place with few or no people, it is not likely to be documented. Many significant tornadoes may not make it into the historical record since Tornado Alley was very sparsely populated during the 20th century.
Much early work on tornado climatology in the United States was done by John Park Finley in his book Tornadoes, published in 1887. While some of Finley’s safety guidelines have since been refuted as dangerous practices, the book remains a seminal work in tornado research. The University of Oklahoma created a PDF copy of the book and made it accessible at John Finley’s Tornadoes (link is external).
Today, nearly all of the United States is reasonably well populated, or at least covered by NOAA’s Doppler weather radars. Even if a tornado is not actually observed, modern damage assessments by National Weather Service personnel can discern if a tornado caused the damage, and if so, how strong the tornado may have been. This disparity between tornado records of the past and current records contributes a great deal of uncertainty regarding questions about the long-term behavior or patterns of tornado occurrence. Improved tornado observation practices have led to an increase in the number of reported weaker tornadoes, and in recent years EF-0 tornadoes have become more prevelant in the total number of reported tornadoes. In addition, even today many smaller tornadoes still may go undocumented in places with low populations or inconsistent communication facilities.
With increased National Doppler radar coverage, increasing population, and greater attention to tornado reporting, there has been an increase in the number of tornado reports over the past several decades. This can create a misleading appearance of an increasing trend in tornado frequency. To better understand the variability and trend in tornado frequency in the United States, the total number of EF-1 and stronger, as well as strong to violent tornadoes (EF-3 to EF-5 category on the Enhanced Fujita scale) can be analyzed. These tornadoes would have likely been reported even during the decades before Doppler radar use became widespread and practices resulted in increasing tornado reports. The bar charts below indicate there has been little trend in the frequency of the stronger tornadoes over the past 55 years.


https://www.ncdc.noaa.gov/climate-information/extreme-events/us-tornado-climatology/trends
Of course it is nonsensical to claim that the bar charts below indicate there has been little trend in the frequency of the stronger tornadoes over the past 55 years – there has clearly been a large reduction.
Note as well that they have not even bothered to update the graph for 2015. Could it be they would rather the public did not find out the truth?
Meanwhile, over at the Storm Prediction Center (SPC) you can see that, when allowance is made for changing reporting procedures, last year may well have had the lowest number of tornadoes on record.

http://www.spc.noaa.gov/wcm/#data
The SPC is also part of NOAA, but is the department that actually deals with tornado events and data on a day to day basis. As such, they tend to be more interested in the facts, rather than a political agenda.
While we still await the final numbers and classification for last year, but what we do know is that there was no EF-5. Indeed the last occurrence was the Moore, OK tornado in May 2013.
It is unusual to go nearly four years without one, as there have been 59 since 1953, effectively one a year on average.
The bottom line is that the NOAA headline graph is grossly dishonest. Indeed, if a company published something like that in their Annual Accounts, they would probably end up in jail!
NOAA themselves know all of this full well.
Which raises the question – why are they perpetuating this fraud?
Birds migrating earlier as temperatures rise
By Paul Homewood | Not A Lot Of People Know That | December 30, 2016
This one was doing the rounds yesterday.
From the BBC:
Migrating birds are arriving at their breeding grounds earlier as global temperatures rise, a study has found.
Birds have reached their summer breeding grounds on average about one day earlier per degree of increasing global temperatures, according to the research by Edinburgh University.
The study looked at hundreds of species across five continents.
It is hoped it will help scientists predict how different species may respond to future environmental change.
Reaching their summer breeding grounds at the wrong time – even by a few days – may cause birds to miss out on maximum availability of vital resources such as food and nesting places.
Late arrival to breeding grounds may, in turn, affect the timing of offspring hatching and their chances of survival.
Long-distance migrants, which are shown to be less responsive to rising temperatures, may suffer most as other birds gain advantage by arriving at breeding grounds ahead of them.
Flowering and breedingTakuji Usui, of Edinburgh University’s school of biological sciences, said: “Many plant and animal species are altering the timing of activities associated with the start of spring, such as flowering and breeding.
“Now we have detailed insights into how the timing of migration is changing and how this change varies across species.
“These insights may help us predict how well migratory birds keep up with changing conditions on their breeding grounds.”
The study examined how various species, which take flight in response to cues such as changing seasonal temperatures and food availability, have altered their behaviour over time and with increasing temperatures.
The researchers examined records of migrating bird species dating back almost 300 years.
The study drew upon records from amateur enthusiasts and scientists, including notes from 19th-century American naturalist Henry David Thoreau.
Species that migrate huge distances – such as the swallow and pied flycatcher – and those with shorter migrations – such as the lapwing and pied wagtail – were included in the research.
The study, published in Journal of Animal Ecology, was supported by the Natural Environment Research Council.
So, let’s get this straight.
One day earlier for each degree of global warming. That means birds are migrating a whole day earlier than during the 19thC.
And we are supposed to be concerned about this?
In fact, given the inter-annual variability, I simply do not believe that these results have any statistical significance whatsoever. The error margins must dwarf the results.
But here’s the thing. Birds have been adapting to changing climate for millennia. It is not the climate that forces them to do anything. Quite the reverse in fact. Birds will adopt the strategy that is most beneficial for them.
The longer they can stay at their summer breeding grounds, the better it is for them, as it allows more time for them to raise their chicks.
The project was funded by the NERC. Isn’t it time we stopped wasting taxpayers’ money on such rubbish?
Skeptical Climate Scientists Coming In From the Cold
By James Varney | RealClearInvestigations | December 31, 2016
In the world of climate science, the skeptics are coming in from the cold.
Researchers who see global warming as something less than a planet-ending calamity believe the incoming Trump administration may allow their views to be developed and heard. This didn’t happen under the Obama administration, which denied that a debate even existed. Now, some scientists say, a more inclusive approach – and the billions of federal dollars that might support it – could be in the offing.
“Here’s to hoping the Age of Trump will herald the demise of climate change dogma, and acceptance of a broader range of perspectives in climate science and our policy options,” Georgia Tech scientist Judith Curry wrote this month at her popular Climate Etc. blog.
William Happer, professor emeritus of physics at Princeton University and a member of the National Academy of Sciences, is similarly optimistic. “I think we’re making progress,” Happer said. “I see reassuring signs.”
Despite harsh criticism of their contrarian views, a few scientists like Happer and Curry have pointed to evidence that global warming is less pronounced than predicted. They have also argued that this slighter warming would bring positive developments along with problems. For the first time in years, skeptics believe they can find a path out of the wilderness into which they’ve been cast by the “scientific consensus.” As much as they desire a more open-minded reception by their colleagues, they are hoping even more that the spigot of government research funding – which dwarfs all other sources – will trickle their way.
President-elect Donald Trump, who has called global warming a “hoax,” has chosen for key cabinet posts men whom the global warming establishment considers lapdogs of the oil and gas industry: former Texas Gov. Rick Perry to run the Energy Department; Attorney General Scott Pruitt of Oklahoma to run the Environmental Protection Agency; and Exxon chief executive Rex Tillerson as secretary of state.
But while general policy may be set at the cabinet level, significant and concrete changes would likely be spelled out below those three – among the very bureaucrats the Trump transition team might have had in mind when, in a move some saw as intimidation, it sent a questionnaire to the Energy Department this month (later disavowed) trying to determine who worked on global warming.
It isn’t certain that federal employees working in various environmental or energy sector-related agencies would willingly implement rollbacks of regulations, let alone a redirection of scientific climate research, but the latter prospect heartens the skeptical scientists. They cite an adage: You only get answers to the questions you ask.
“In reality, it’s the government, not the scientists, that asks the questions,” said David Wojick, a longtime government consultant who has closely tracked climate research spending since 1992. If a federal agency wants models that focus on potential sea-level rise, for example, it can order them up. But it can also shift the focus to how warming might boost crop yields or improve drought resistance.
While it could take months for such expanded fields of research to emerge, a wider look at the possibilities excites some scientists. Happer, for one, feels emboldened in ways he rarely has throughout his career because, for many years, he knew his iconoclastic climate conclusions would hurt his professional prospects.
When asked if he would voice dissent on climate change if he were a younger, less established physicist, he said: “Oh, no, definitely not. I held my tongue for a long time because friends told me I would not be elected to the National Academy of Sciences if I didn’t toe the alarmists’ company line.”
That sharp disagreements are real in the field may come as a shock to many people, who are regularly informed that climate science is settled and those who question this orthodoxy are akin to Holocaust deniers. Nevertheless, new organizations like the CO2 Coalition, founded in 2015, suggest the debate is more evenly matched intellectually than is commonly portrayed. In addition to Happer, the CO2 Coalition’s initial members include scholars with ties to world-class institutions like MIT, Harvard and Rockefeller University. The coalition also features members of the American Geophysical Union and the American Meteorology Society, along with policy experts from the Manhattan Institute, the George C. Marshall Institute and Tufts University’s Fletcher School.
With such voices joining in, the debate over global warming might shift. Until now, it’s normally portrayed as enlightened scholars vs. anti-science simpletons. A more open debate could shift the discussion to one about global warming’s extent and root causes.
Should a scientific and research funding realignment occur, it could do more than shatter what some see as an orthodoxy stifling free inquiry. Bjorn Lomborg, who has spent years analyzing potential solutions to global warming, believes that a more expansive outlook toward research is necessary because too much government funding has become expensive and ineffective corporate welfare. Although not a natural scientist, the social scientist Lomborg considers climate change real but not cataclysmic.
“Maybe now we’ll have a smarter conversation about what actually works,” Lomborg told RealClearInvestigations. “What has been proposed costs a fortune and does very little. With more space opening up, we can invest more into research and development into green energy. We don’t need subsidies to build something. They’ve been throwing a lot of money at projects that supposedly will cut carbon emissions but actually accomplish very little. That’s not a good idea. The funding should go to universities and research institutions; you don’t need to give it to companies to do it.”
Such new opportunities might, in theory, calm a field tossed by acrimony and signal a détente in climate science. Yet most experts are skeptical that a kumbaya moment is at hand. The mutual bitterness instilled over the years, the research money at stake, and the bristling hostility toward Trump’s appointees could actually exacerbate tensions.
“I think that the vast ‘middle’ will want and seek a more collegial atmosphere,” Georgia Tech’s Curry told RealClearInvestigations. “But there will be some hardcore people (particularly on the alarmed side) whose professional reputation, funding, media exposure, influence etc. depends on cranking up the alarm.”
Michael E. Mann, another climate change veteran, is also doubtful about a rapprochement. Mann, director of the Earth System Science Center at Penn State and author of the “hockey stick” graph, which claims a sharp uptick in global temperatures over the past century, believes ardently that global warming is a dire threat. He concluded a Washington Post op-ed this month with this foreboding thought: “The fate of the planet hangs in the balance.” Mann acknowledges a brutal war of words has engulfed climate science. But in an e-mail exchange with RealClearInvestigations, he blamed opponents led by “the Koch brothers” for the polarization.
Mann did hint, however, there may be some room for discussion.
“In that poisonous environment it is difficult to have the important, more nuanced and worthy debate about what to do about the problem,” he wrote. “There are Republicans like Arnold Schwarzenegger, Bob Inglis and George Shultz trying to create space for that discussion, and that gives me hope. But given that Donald Trump is appointing so many outright climate deniers to key posts in this administration, I must confess that I – and many of my fellow scientists – are rather concerned.”
Neither side of the debate has been immune from harsh and sinister attacks. Happer said he stepped down from the active faculty at Princeton in part “to deal with all this craziness.” Happer and Mann, like several other climate scientists, have gotten death threats. They provided RealClearInvestigations with some of the e-mails and voice messages they have received.
“You are an educated Nazi and should hang from the neck,” a critic wrote Happer in October 2014.
“You and your colleagues who have promoted this scandal ought to be shot, quartered and fed to the pigs along with your whole damn families,” one e-mailed Mann in Dec. 2009.
Similar threats have bedeviled scientists and writers across the climate research spectrum, from Patrick Michaels, a self-described “lukewarmer” who dealt with death threats at the University of Virginia before moving to the Cato Institute, to Rajendra Pachauri, who protested anonymous death threats while heading the United Nations Intergovernmental Panel on Climate Change (IPCC).
Putting such ugliness aside, some experts doubt that the science will improve even if the Trump administration asks new research questions and funding spreads to myriad proposals. Richard Lindzen, the Alfred P. Sloan Professor of Meteorology at MIT and a member of the National Academy of Sciences who has long questioned climate change orthodoxy, is skeptical that a sunnier outlook is upon us.
“I actually doubt that,” he said. Even if some of the roughly $2.5 billion in taxpayer dollars currently spent on climate research across 13 different federal agencies now shifts to scientists less invested in the calamitous narrative, Lindzen believes groupthink has so corrupted the field that funding should be sharply curtailed rather than redirected.
“They should probably cut the funding by 80 to 90 percent until the field cleans up,” he said. “Climate science has been set back two generations, and they have destroyed its intellectual foundations.”
The field is cluttered with entrenched figures who must toe the established line, he said, pointing to a recent congressional report that found the Obama administration got a top Department of Energy scientist fired and generally intimidated the staff to conform with its politicized position on climate change.
“Remember this was a tiny field, a backwater, and then suddenly you increased the funding to billions and everyone got into it,” Lindzen said. “Even in 1990 no one at MIT called themselves a ‘climate scientist,’ and then all of a sudden everyone was. They only entered it because of the bucks; they realized it was a gravy train. You have to get it back to the people who only care about the science.”
100% Of US Warming Is Due To NOAA Data Tampering
By Tony Heller | The Deplorable Climate Science Blog | December 28, 2016
Climate Central just ran this piece, which the Washington Post picked up on. They claimed the US was “overwhelmingly hot” in 2016, and temperatures have risen 1,5°F since the 19th century.
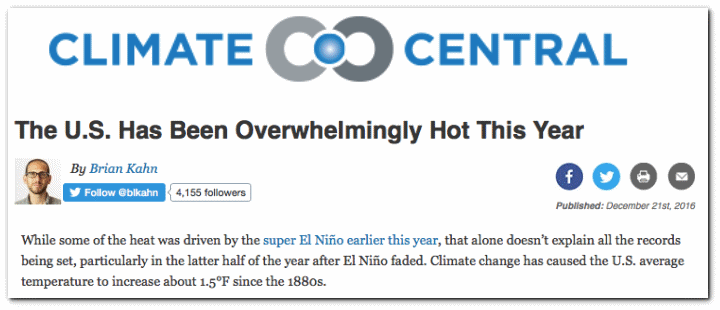
The U.S. Has Been Overwhelmingly Hot This Year | Climate Central
The first problem with their analysis is that the US had very little hot weather in 2016. The percentage of hot days was below average, and ranked 80th since 1895. Only 4.4% of days were over 95°F, compared with the long term average of 4.9%. Climate Central is conflating mild temperatures with hot ones.
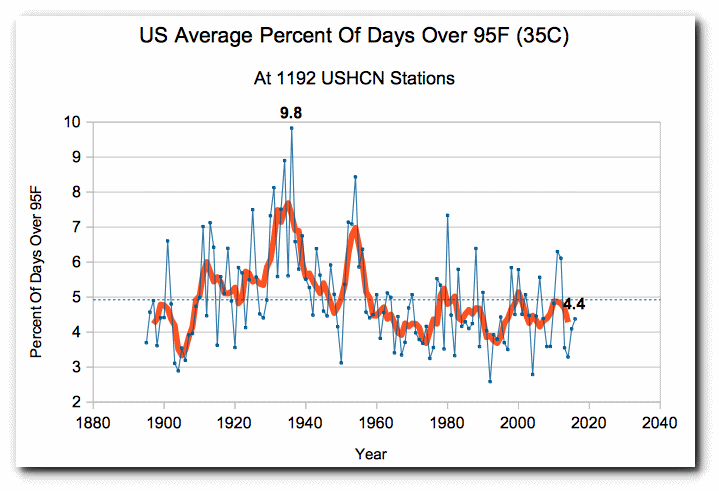
They also claim US temperatures rose 1.5°F since the 19th century, which is what NOAA shows.
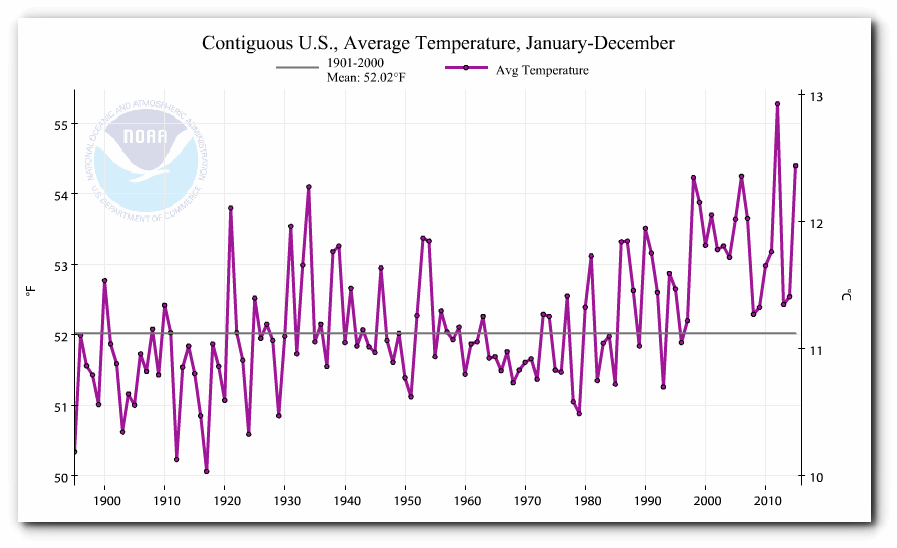
Climate at a Glance | National Centers for Environmental Information (NCEI)
The problem with the NOAA graph is that it is fake data. NOAA creates the warming trend by altering the data. The NOAA raw data shows no warming over the past century
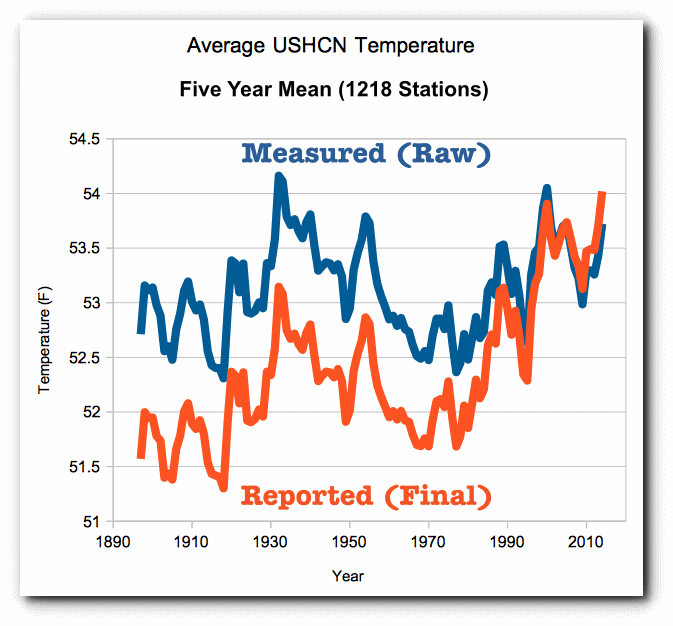
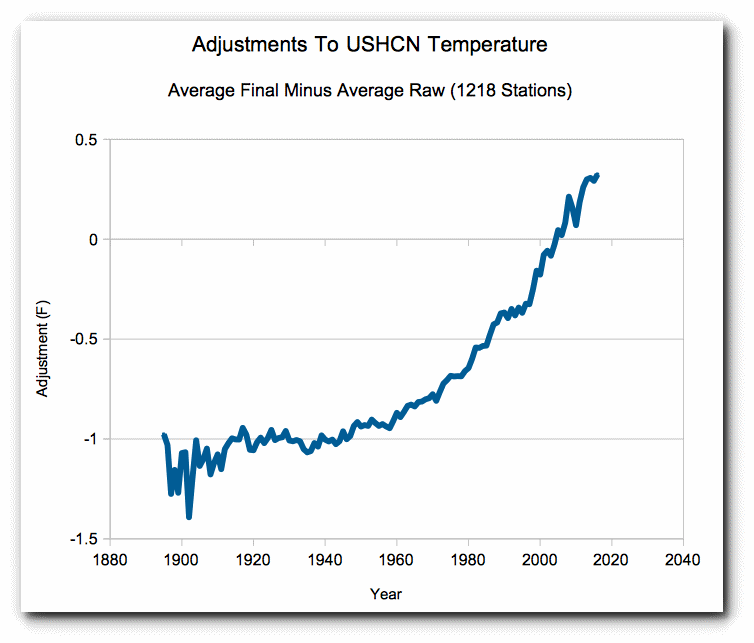
The adjustments being made are almost exactly 1.5°F, which is the claimed warming in the article.
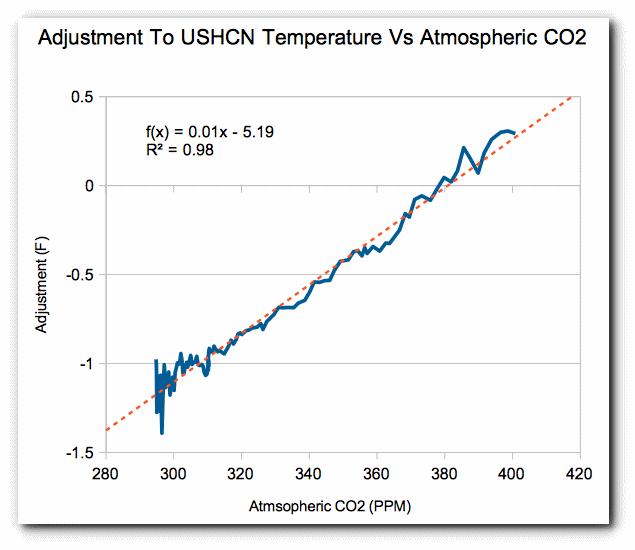
The adjustments correlate almost perfectly with atmospheric CO2. NOAA is adjusting the data to match global warming theory. This is known as PBEM (Policy Based Evidence Making.)
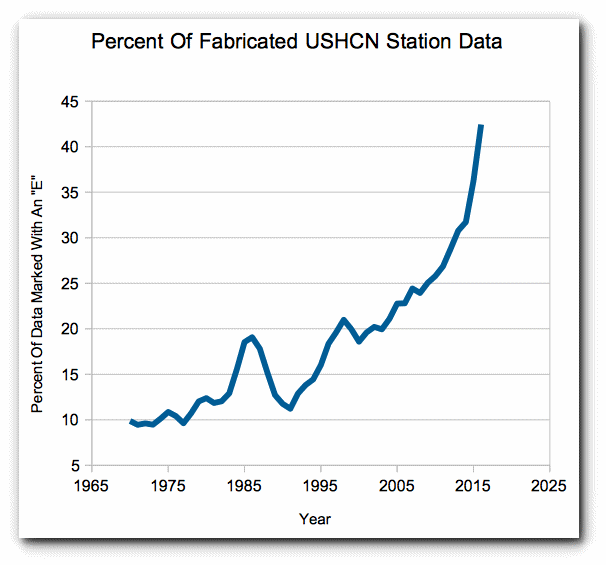
The hockey stick of adjustments since 1970 is due almost entirely to NOAA fabricating missing station data. In 2016, more than 42% of their monthly station data was missing, so they simply made it up. This is easy to identify because they mark fabricated temperatures with an “E” in their database.
When presented with my claims of fraud, NOAA typically tries to arm wave it away with these two complaints.
- They use gridded data and I am using un-gridded data.
- They “have to” adjust the data because of Time Of Observation Bias and station moves.
Both claims are easily debunked. The only effect that gridding has is to lower temperatures slightly. The trend of gridded data is almost identical to the trend of un-gridded data.
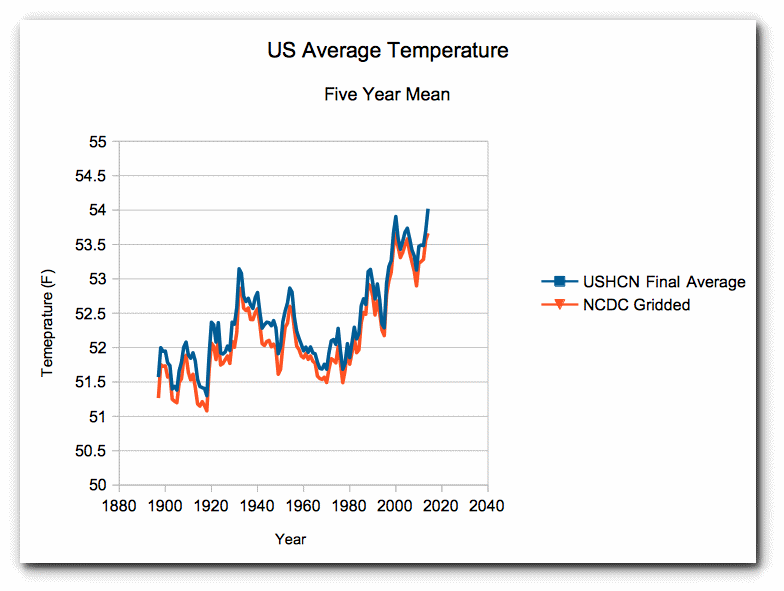
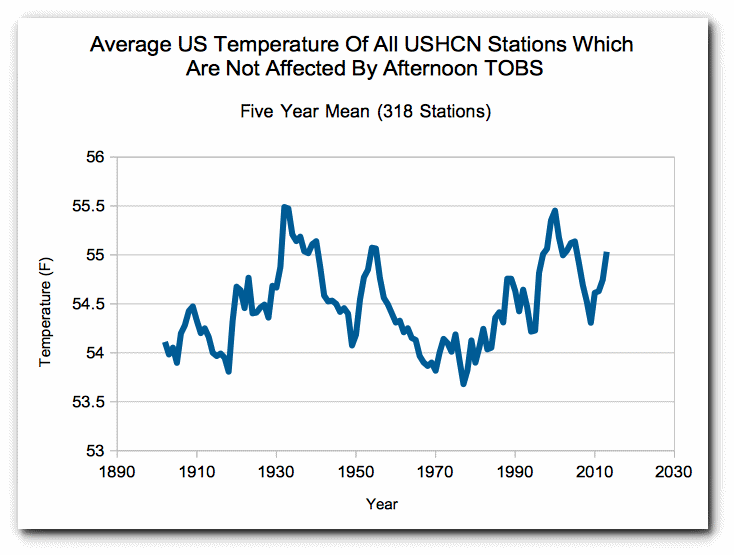
Time of Observation Bias (TOBS) is a real problem, but is very small. TOBS is based on the idea that if you reset a min/max thermometer too close to the afternoon maximum, you will double count warm temperatures (and vice-versa if thermometer is reset in the morning.) Their claim is that during the hot 1930’s most stations reset their thermometers in the afternoon.
This is easy to test by using only the stations which did not reset their thermometers in the afternoon during the 1930’s. The pattern is almost identical to that of all stations. No warming over the past century. Note that the graph below tends to show too much warming due to morning TOBS.
NOAA’s own documents show that the TOBS adjustment is small (0.3°F) and goes flat after 1990.
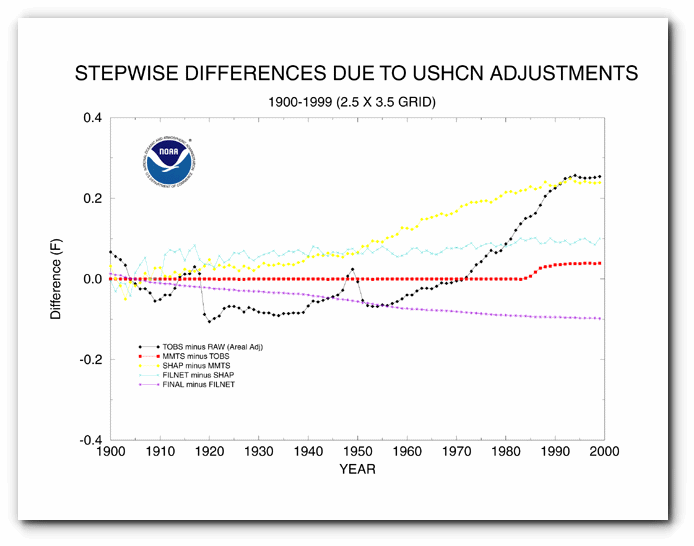
https://www.ncdc.noaa.gov/img/climate/research/ushcn/ts.ushcn_anom25_diffs_pg.gif
Gavin Schmidt at NASA explains very clearly why the US temperature record does not need to be adjusted.
You could throw out 50 percent of the station data or more, and you’d get basically the same answers.
One recent innovation is the set up of a climate reference network alongside the current stations so that they can look for potentially serious issues at the large scale – and they haven’t found any yet.
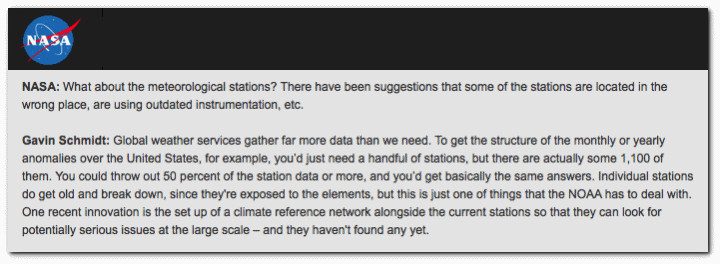
NASA – NASA Climatologist Gavin Schmidt Discusses the Surface Temperature Record
NOAA has always known that the US is not warming.
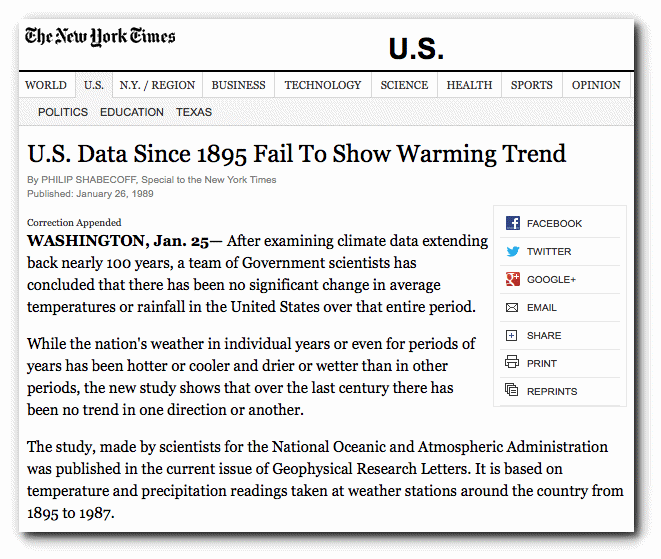
U.S. Data Since 1895 Fail To Show Warming Trend – NYTimes.com
All of the claims in the Climate Central article are bogus. The US is not warming and 2016 was not a hot year in the US. It was a very mild year.
Phil Jones Steps Down
By Paul Homewood | Not A Lot Of People Know That |December 27, 2016

http://www.edp24.co.uk/news/environment/uea_s_climatic_unit_director_steps_down_1_4829565
One down!
Eastern Daily Press | December 27, 2016
Climatologist Prof Phil Jones, who was at the centre of the Climategate row over hacked emails, will be succeeded by Prof Timothy Osborn.
Prof Osborn, who has worked at the UEA since 1990, said: “UEA provides a superb environment for climate research and so it is a privilege for me to become the Climatic Research Unit’s next director of research.
“I’m looking forward to leading our pioneering climate research, establishing with greater certainty the details of how and why the Earth’s climate is changing and the consequences for the future.”
No doubt Phil’s well earned retirement will give ample opportunity to adjust homogenise his golf scores!
Final Christmas Of The Global Warming Fraud
By Tony Heller | The Deplorable Climate Science Blog | December 25, 2016
“Early in life I had noticed that no event is ever correctly reported in a newspaper” – George Orwell
Recognizing that their time is up on January 20, 2017, global warming fraudsters have turned the volume up to eleven with fake news that the Arctic is hot at Christmas.

The Arctic is extremely cold, but there is a very narrow band of relatively mild air running along the Prime Meridian across the pole.
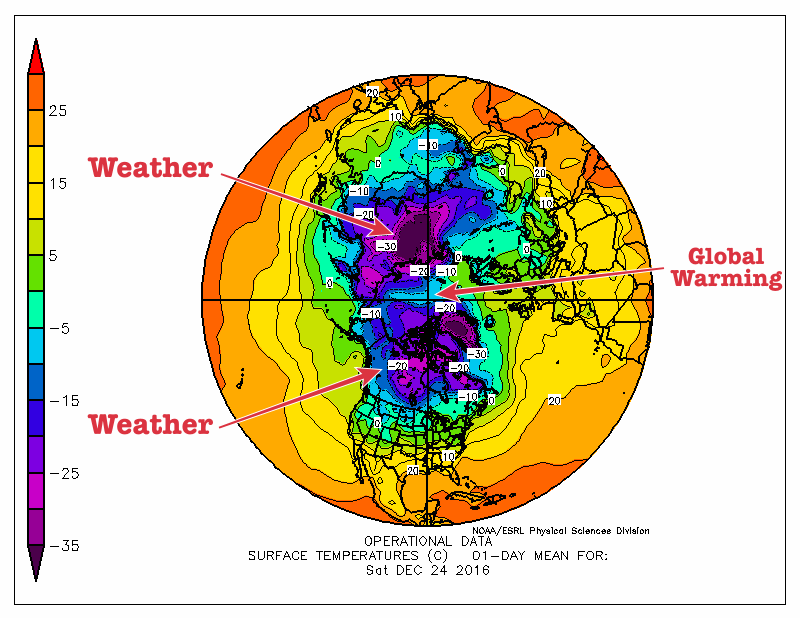
https://www.esrl.noaa.gov/psd/map/images/fnl/sfctmp_01.fnl.html
Greenland is extremely cold, and has gained a record amount of ice this year.
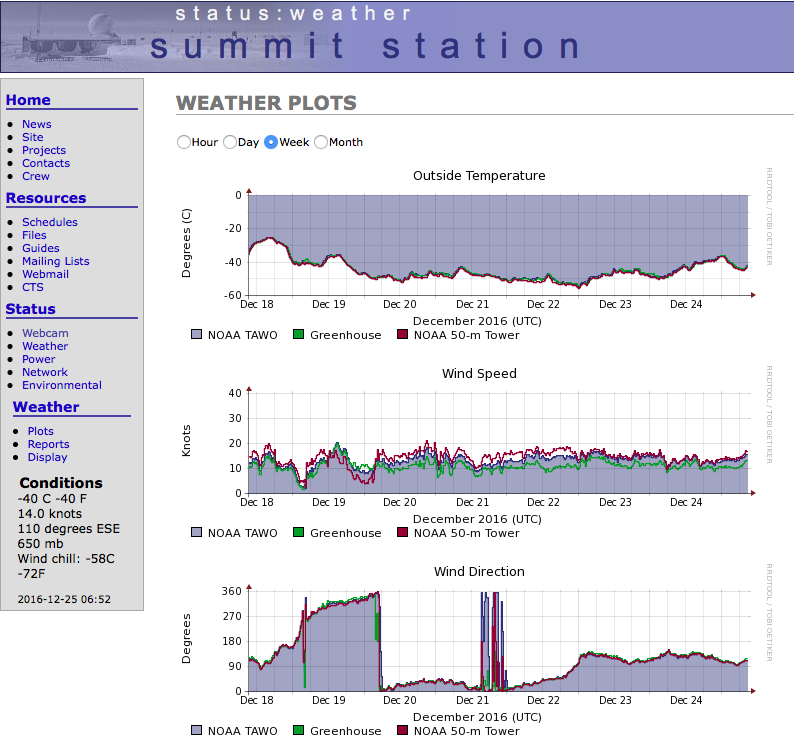
http://www.summitcamp.org/status/weather/index?period=1week

http://beta.dmi.dk/en/groenland/maalinger/greenland-ice-sheet-surface-mass-budget/
It was all-time record cold -80F in Siberia this week, as the fraudsters behind the climate scam tell the public the Arctic is “super-hot.”
In Surgut a woman was cycling at minus 43C.
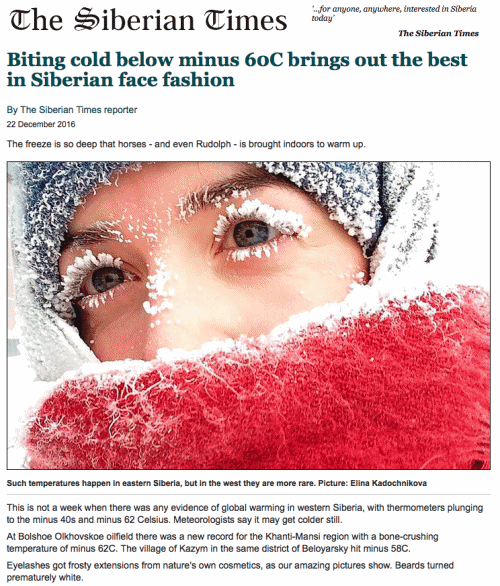
Biting cold below minus 60C brings out the best in Siberian face fashion
There are only 90 days per year when the North Pole can melt, and those dates have been running colder than normal in recent years.
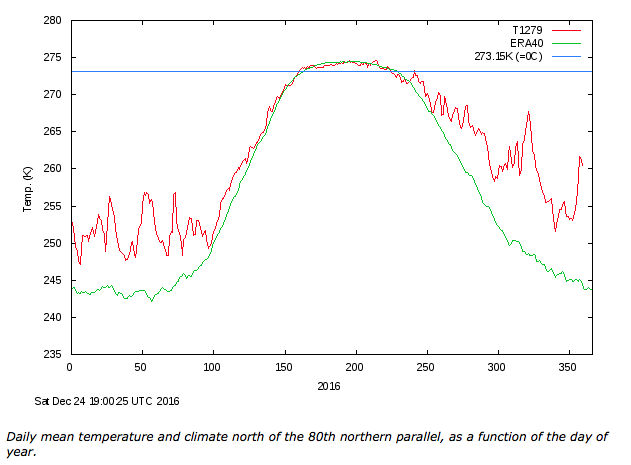
http://ocean.dmi.dk/arctic/meant80n.uk.php
Heatwaves in the Arctic have been occurring for as long as people have been visiting there.
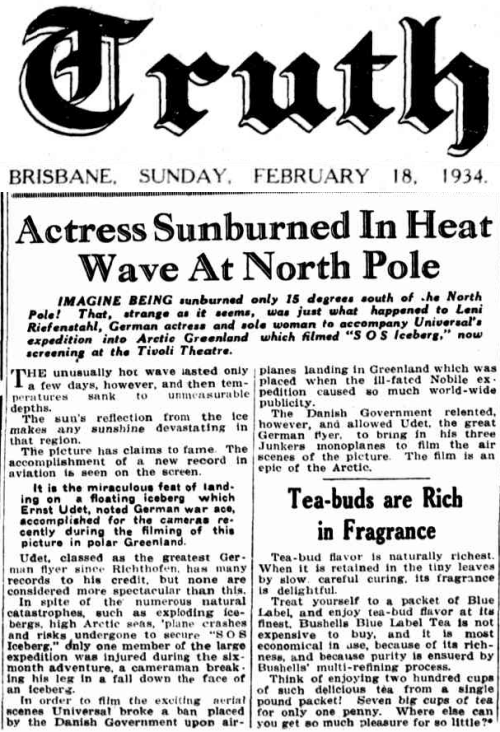
Actress Sunburned In Heat Wave At North Pole
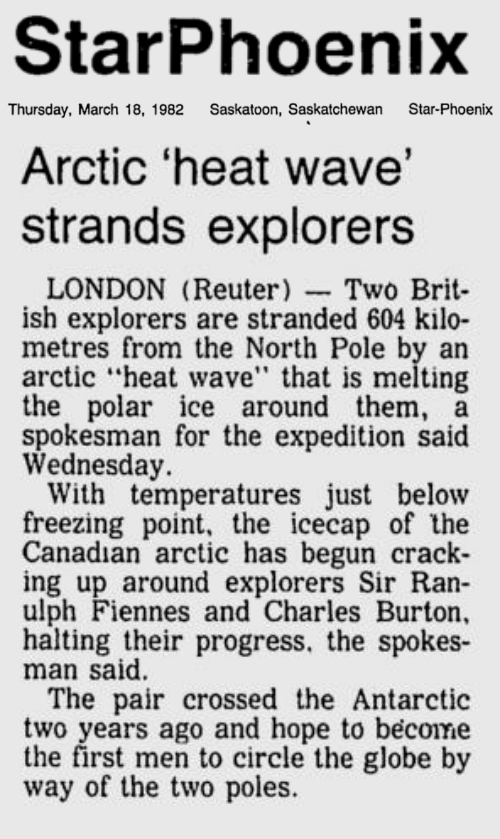
The Phoenix – Google News Archive Search
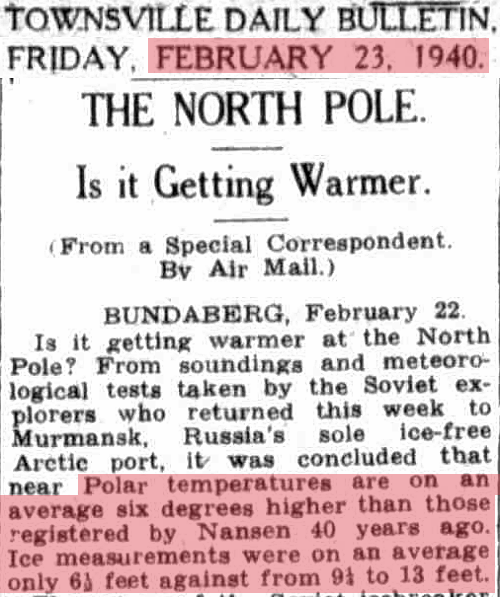
Ice at the pole is currently two meters thick, the same as it was in 1940.
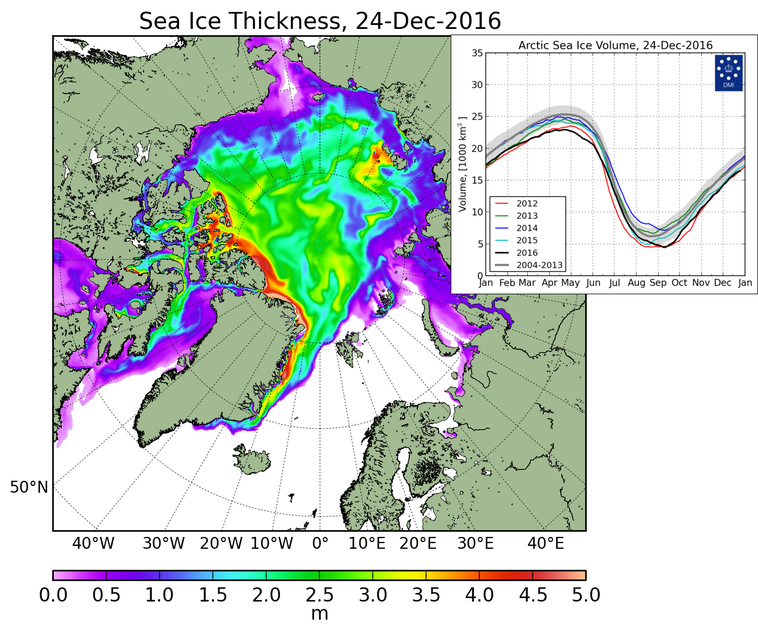
http://ocean.dmi.dk/arctic/icethickness/thk.uk.php
In 1940, the ice at the pole was also two meters thick.
The fake news press has been pulling this same Arctic scam for as long as anyone can remember. Arctic conditions are the same as they were 60 years ago, and they have been predicting an ice-free Arctic for as long as anyone can remember.
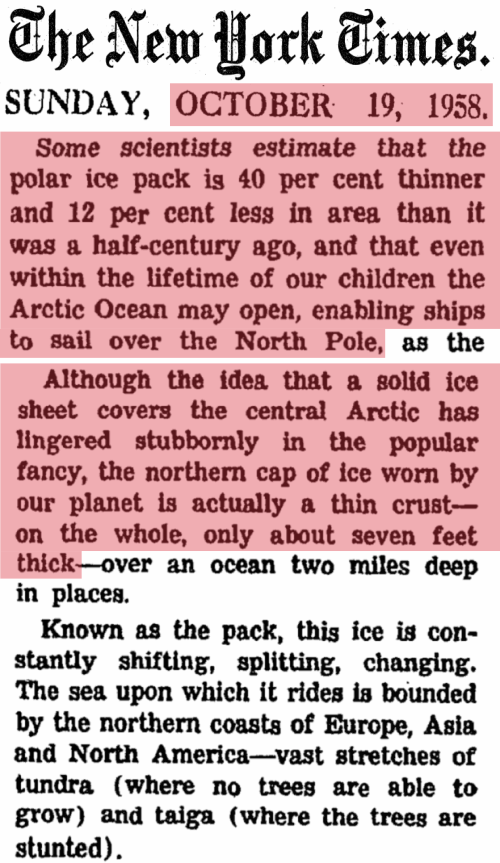
The Changing Face of the Arctic; The Changing Face of the Arctic – The New York Times
Homogenization of Temperature Data By the Bureau of Meteorology
By Brendan Godwin | Watts Up With That? | December 21, 2016
Background
I worked for Australia’s Bureau of Meteorology – BOM for 2 years from 1973 to 1975. I was trained in weather observation and general meteorology. I spent 1 year observing Australia’s weather and 1 year observing the weather at Australia’s Antarctic station at Mawson.
As part of it’s Antarctic program, Australia drills ice cores at Law Dome near it’s Casey station. On our return journey in 1975 we repatriated a large number of ice cores for scientific analysis. The globe’s weather and climate records are stored in these ice cores for the past 1 million years approximately.
Australia’s Antarctic program went by the name of Australian National Antarctic Research Expedition or ANARE for short. This is now known as Australian Antarctic Division or AAD. Returned expeditions formed a club called the ANARE Club of which I have been a member since 1975. Members have many functions and reunions and they have a reunion dinner every year. At this dinner there has always been guest speakers from Australia’s Antarctic Division. These guest speakers are usually someone of the caliber of the Divisions Chief Scientist or the Operations Manager and the talks are designed to keep members updated on the Antarctic scientific program.
The annual dinner is also a place where members keep in touch with each other and network and this communication continues throughout the year via email.
The International Panel on Climate Change – IPCC
The IPCC was created by and is a joint 50/50 partnership between the World Meteorological Organisation – WMO and United Nations Environment Programme (UNEP). It has extremely narrow terms of reference in that it’s role is to determine that humans are causing global warming. In that regard it is only looking at human induced forcings over the past 150 years, just to make sure it reaches that result. That makes it a political body with a political agenda.
World Meteorological Organisation – WMO
The WMO has structurally changed since 1974. Today it is headquartered in Geneva, Switzerland. When I went through training with the BOM, the WMO had a shared global headquarters between Melbourne, New York, Moscow and London. I don’t know when this structure changed. Australia had a leading role in the WMO and was a dissemination point for weather data.
Australia’s Bureau of Meteorology – BOM
BOM’s headquarters are in Melbourne. Australia has claim to 5.9 million square kilometres, about 42% of Antarctica. That claim is on hold while the Antarctic Treaty is in place. On the Antarctic continent Australia has 3 full time stations, Mawson, Davis and Casey, as well as a 4th, Macquarie Is., in the Southern Ocean. BOM has a full time presence on all these stations. Weather data is collected throughout the day and night at all these stations. At Mawson in 1974, we collected not only our own data but all the weather data from Davis, the Japanese station at Syowa and the Russian station at Molodezhnaya. Mawson sent all this data to the Overseas Telecommunications Commission – OTC in Sydney where it was forwarded on to BOM in Melbourne. A second Russian station, Mirny, was collected by Casey and forwarded on the BOM Melbourne via OTC.
BOM used this data, in conjunction with all the observational data obtained from all the weather stations and observational points throughout Australia, as part of Australia’s weather maps and forecasting. Additionally, Melbourne was the WMO distribution point for all weather data in our region. BOM Melbourne collected and collated all this data and forwarded it on to the WMO.
Temperature Data and IPCC’s Climate Change
In 2013 I attended an ANARE Midwinter Dinner – MWD. Australian Antarctic Division – AAD’s Acting Chief Scientist Dr Martin Riddle was our guest speaker at this function. I met with him over canapes before the dinner and spoke with him for about 20 minutes. I tried to get a sneak preview what his talk was going to be about. He said he was Australia’s lead scientist on the IPCC and, aside from giving us an update on the scientific program in the Antarctic, he was going to talk about climate and global warming. I asked him, were we not in an interglacial warm period in the 100,000 year Milankovitch Cycle and wasn’t all this current warming natural? His jaw dropped and was aghast. Our discussion ended there and he raced off not looking too happy. I couldn’t help but getting the feeling that I wasn’t supposed to know anything about the Milankovitch Cycles. It seemed like no one was supposed to know this.
It seems apparent that we all are just supposed to listen to what the IPCC are telling us and don’t ask questions. So what are the IPCC telling us?
The IPCC have produced 102 climate models to predict our future climate. The world’s meteorological organizations use weather models to forecast and predict weather and have been for many years. They have proved to be very accurate over 4 days and reasonably accurate over a week. The IPCC’s climate models are notoriously inaccurate. We’ve had these models now for some 30 years and we now have 30 years of data to compare them against. They are not even close to accurate.
Dr Roy Spencer is a meteorologist, Principal Research Scientist at the University of Alabama in Huntsville, and the U.S. Science Team leader for the Advanced Microwave Scanning Radiometer on NASA’s Aqua satellite. At an International Conference on Climate Change in his presentation he said referring to the IPCC models below.
Climate models are not even forecasting. Those curves on the chart are hindcasts.¹ They already knew what the answer was but still can’t get them right.

In spite of this, the IPCC seem adamant that there is nothing wrong with their models and it must be the data that is not right. Roy Spencer said: There’s no comparison. The IPCC are now hinting, maybe we shouldn’t trust the observations, let’s just trust the models.
Temperature Adjustments – Homogenization
One has to be excused for being skeptical here but it does look prima facie like the IPCC has asked their 50% partner, the WMO, to give them some temperature data that more closely matches their models. At least 3 of the WMO’s senior partners, BOM – Australia, National Oceanic and Atmospheric Administration – NOAA – America and Met Office – UK are adjusting their temperature data to something that has a much more closer resemblance to the IPCC’s models. There is no evidence that Hydrometeorological Centre of Russia – (Roshydromet), is involved with these adjustments.
They are taking this:

And turning it into this:

An Australian scientist, Jennifer Marohasy, has been taking a close interest in the adjustments BOM are making.² She produces weather forecasting models and has a grave concern about these adjustments. One of the data inputs to weather forecasting models in temperature. It appears that the temperature is not correct/accurate now.None of these organizations will say or explain what they are doing or are being vague when asked. Raw data is being removed from public scrutiny and no one knows if it is actually being destroyed. Officially they are providing no scientific basis for making these adjustments. The adjustments they are making are complex. The 1940/41 and 1998 El Ninos have been wiped from these records.
But they haven’t just lowered and raised the temperatures in one hit, they’ve slowly incriminated the adjustments so that it all looks natural. If they’d lowered and raised them in one hit you’d have a chart that looks like this.

At one of our recent MWD reunions I caught up with and spoke to a colleague who spent many years working at the BOM as a weather observer and forecaster both in Antarctica and Australia. This person is outside of the realm of politics and wishes to remain anonymous. The person’s last job was working on these temperature adjustments. The job of this person’s team was to adjust the temperatures upwards so has been working on adjustments from 1990 until the present.
I asked, why was BOM making these adjustments and it was explained to me this way.
When there are temperature observational points located in the CBD area of large cities where there are tall buildings, it has been well known to BOM and generally, that these temperatures would be half to one and a half degrees C cooler if the tall building and the city wasn’t there. It is a phenomenon known as “the island effect”. It is the same as when, on a cold day, the hairs on your arm stand up and that insulates a warm layer of air close to the skin. Tall buildings do the same thing. Additionally, these tall buildings are heated and air conditioned and every time people walk in and out of the building, hot or cold air blows out altering the ambient street temperatures.
But the anomaly in what this person is saying here is that this person’s team is adjusting country temperatures upwards by half to one and a half degrees C so that they match the city temperatures. That’s creating about a degree C of warming when if they had adjusted the city temperatures down half to one and a half degrees C, they’d be creating approximately a half a degree of cooling.
Jennifer Marohasy’s charts for Rutherglen in country Victoria show this quite clearly. Note these are truncated to 1910.

Conclusion
The Australian Climate Observations Reference Network–Surface Air Temperature (ACORN-SAT) Technical Advisory Forum released a report in 2015 confirming that the Surface Air Temperatures were being adjusted, confirming the process is called Homogenization, confirming that other weather monitoring institutions around the world are making these same adjustments and purporting to justify why the adjustments are being made. Observing practices change, thermometers change, stations move from one location to another and new weather stations are installed. They refused to release their complex mathematical formula used to make the adjustments. They claim that homogenisation is essential in eliminating artificial non-climate systematic errors in temperature observations. non-climate related factors include:
- the replacement of thermometers;
- changes in observing practices;
- expansion of the network into remote locations;
- changes in infrastructure surrounding a weather station;
- relocation of weather stations.
The only reason on that list that really makes any sense is changes in infrastructure surrounding a weather station. You can’t calibrate a thermometer used 100 years ago with one used today. When reviewing Jennifer Marohasy’s paper on Rutherglen, just as one example, none of the above apply yet Rutherglen’s temperatures were still adjusted. In her report Jennifer wrote:
In a special advisory issued by the Bureau in September 2014, it is claimed that the adjustments – which create the artificial warming trend in the homogenised temperature minima – were necessary to make the Rutherglen series consistent with the trends measured at neighbouring weather stations. However, it is apparent that in this advisory, annual raw minima values from Rutherglen are compared with data from neighbouring sites that have already been homogenised. This approach, which may once have been considered fraudulent, is now consistent with the postmodernist epistemology that underpins homogenisation as practiced by the Bureau . . .
Jennifer has requested of BOM why Rutherglen was adjusted when none of the BOM’s homogenization criteria applied and received no response.
My observation of all of this is that these so called reasons for making these adjustments are not reasons but excuses. If any adjustments are to be made, city/urban temperatures should be adjusted down to match what the temperature would be without tall buildings. Adjusting country/regional temperatures upwards to match the city is a fabrication to suit an hypothesis or agenda and the reasons are just an excuse. If there was any real reason for an adjustment, aside from the island effect in cities, it would be for where there is a Stevenson Screen out in the middle of an asphalt car park. That temperature should be adjusted down. Yet all these adjustments are both up and down, depending on the time period, with the end result a temperature chart that resembles catastrophic warming. And that is coincidentally exactly what the IPCC are looking for.
That makes these adjustments political not scientific.
- It is reasonable to make certain adjustments that are intended to improve accuracy.
- Adjustments should be rare.
- Adjustments should not be to suit a political purpose and there should be no mechanism that allows to even make this possible.
- As a scientific practice, the reporting agencies should ALWAYS maintain and report the original raw data. It should be publicly available for download. It should be easy to find and not buried under numerous web pages making it impossible to find.
Once you start introducing reasons to make adjustments then it becomes too easy to use them as an excuse to adjust everything to suit a purpose. It becomes easy to allow for political interference. Political interference should be impossible.
1 https://www.youtube.com/watch?v=ExgKJpJyDXQ
2 Temperature Change at Rutherglen in South-East Australia
Brendan Godwin was a Radio Technical and Officer Weather Observer Bureau of Meteorology for Mawson Station in the Antarctic 1974
Featured Video

Dan Dicks with James Corbett on Solutions Watch
or go to
Aletho News Archives – Video-Images
From the Archives
MMR (Measles, Mumps and Rubella) – Vaccine Risk Statement
MMR Vaccine (Measles, Mumps, and Rubella) Is It Safer Than Measles, Mumps and Rubella?
Physicians for Informed Consent | December 2024
… It has not been proven that the MMR vaccine is safer than measles, mumps, and rubella. The vaccine package insert raises questions about safety testing for cancer, genetic mutations, and impaired fertility. Although VAERS tracks some adverse events, it is too inaccurate to measure against the risk of measles, mumps, and rubella. Clinical trials do not have the ability to detect less common adverse reactions, and epidemiological studies are limited by the effects of chance and possible confounders. Safety studies of the MMR vaccine are particularly lacking in statistical power. A review of more than 60 MMR vaccine studies conducted for the Cochrane Library states, “The design and reporting of safety outcomes in MMR vaccine studies, both pre- and post-marketing, are largely inadequate.”19 Because permanent sequelae (aftereffects) from measles, mumps, and rubella are so rare (especially in children with normal levels of vitamin A and infected after birth),6,15-17 the level of accuracy of the research studies available is insufficient to rule out the possibility that the MMR vaccine causes greater death or permanent disability than measles, mumps, and rubella. – Read full article
Blog Roll
 Aletho News
- Moscow issues warning to NATO over Russian exclave
- Yes, the Iran war has destroyed Trump’s presidency
- The fallacy of US delusions about Iran’s economic collapse
- Hezbollah denies Syria cell link, warns of Israeli plan to sow discord
- The legacy of US sanctions, war, and occupation in Iraq
- Iraqi resistance group rejects disarmament, vows to maintain support for Lebanon
- Sheikh al-Asadi warns of Iraqi government compliance with US demands
- How to MAKE THE CONSPIRATORS PAY for their crimes! Dan Dicks with James Corbett on Solutions Watch
- There’s a drought in academia: A drought in honest research on the subject of drought and other weather extremes
- Department of War Awards $20.7 Billion Contract to Raytheon for Air-to-Air Missiles
- If Americans Knew
- An error has occurred; the feed is probably down. Try again later.
- No Tricks Zone
- Green Energy Debacle: German Expert Professor Fritz Vahrenholt Warns Of Severe Economic And Social Consequences
- Two More Paleo Reconstructions Affirm Meters-Higher Sea Levels Across Ireland, Brazil 7000-6000 Years Ago
- New Study: Earth And Venus Surface Warmth Largely Explained By Convection And Lapse Rate, Not CO2 Or Radiation
- 2025 Nature Paper Claiming Worsening Global Drought Gets RETRACTED …Heavily Flawed
- New Study: ‘Global Drought Shows No Detectable Recent Acceleration Under Climate Warming’
- Economic Masterminds: German Socialists Suggest Taxing Productivity Gains Stemming From Using AI
- The South China Sea Has Not Been Cooperating With The Climate Change Narrative
- Energy Crisis: Germany Enters Heating Season With Historically Low Gas Reserve Fill Levels
- New Study: The Antarctic Ice Sheet Gained Mass From 2020-2024 Due To Staggering Snow And Ice Accumulation
- Study: Ocean Heating Rates From Thousands Of Years Ago ‘Dwarf’ Modern Ocean Heating Rates


