Butterflies And Junk Science
By Paul Homewood | Not A Lot Of People Know That | December 16, 2017

Camille Parmesan
Climate scientist, Camille Parmesan, is one of the recipients of President Macron’s largesse in awarding $70 million to US scientists.
I wonder whether the French public realise how much junk science they will be paying for.
Parmesan is famous for her studies on butterflies, which she argues are being forced polewards, and even being extinguished, because of climate change.
However, Jim Steele, Director emeritus Sierra Nevada Field Campus, San Francisco State University was not convinced by her work, and decided to take a closer look.
Here is his account, as published at WUWT in 2013:
Guest essay by Jim Steele, Director emeritus Sierra Nevada Field Campus, San Francisco State University
The pioneers of chaos theory coined the term “butterfly effect” to suggest that a hurricane’s formation could be affected by such unpredictable influences as the flap of a distant butterfly’s wings that changed the winds’ direction weeks before. Ironically, it was Dr. Camille Parmesan’s 1996 seminal Edith’s checkerspot butterfly paper titled “Species and Climate Range”1 that became the model for future peer-reviewed papers that blamed climate change for driving species northward and upward and causing species extinctions. Featured on the Union of Concerned Scientists’ website, Parmesan echoed Dr. Jim Hansen’s catastrophic predictions that global warming was already forcing global ecological collapse, “The latest research shows clearly that we face the threat of mass extinctions in coming years,” she says.
“My hope is that we will be able to reduce emissions enough so that assisted colonization efforts can be successful, because at the higher ranges of scientists’ projections of warming trends, frankly, we’re sunk.” For promoting global warming theory, she subsequently earned an invitation to speak at the White House and became one of just four biologists to partake in third global climate assessment by the United Nations’ Nobel-Prize-winning Intergovernmental Panel on Climate Change (IPCC). By 2009, Parmesan ranked as the second-most cited author of papers devoted expressly to global warming and climate change.2

Euphydryas editha in Olympic National Park Image: Wikipedia
Einstein said, “A question that sometimes drives me hazy: am I or are the others crazy?” and the fanfare given Parmesan drove me hazy. Detailed studies by butterfly experts and conservationists dedicated to saving the butterfly from extinction had all blamed habitat destruction and sought habitat restoration. In contrast Parmesan blamed global warming and argued for reduced carbon emissions. She had blamed “global” warming even though most maximum temperatures in California had not risen significantly.3 More disconcerting the butterflies never migrated northward or upward, as claimed. Yet she now seeks funding to support an ecologist’s worst nightmare, assisted colonization. Parmesan wants to create her own Noah’s ark shuttling animals northwards and upwards so they can escape the supposed rising tide of warmth predicted by models, despite the fact that introducing species into new habitat brings disease and disrupts the established ecological balance.

To her credit Parmesan had diligently spent four years of extensive and laborious fieldwork revisiting locations where the butterfly had been observed earlier in the century. However after verifying that more populations had gone extinct in the southern extremes and at the lowest elevations of the butterfly’s range, Parmesan enthusiastically claimed her results were consistent with global warming theory. In 2010 she summarized her work: “it was a bloody obvious change. These butterflies were shifting their entire range over the past century northward and upward, which is the simplest possible link you could have with warming. I was expecting some incredibly subtle, sophisticated response to warming, if at all. What I got was 80% of the populations in Mexico and the Southern California populations were extinct, even though their habitats still looked perfectly fine.”2 But as I discovered later Parmesan always knew the butterflies had never migrated further north or to higher elevations.
Hansen’s global warming theory had predicted that the increasing maximum temperatures would push animals northward and upward, however Parmesan failed to mention that most of California’s maximum temperatures had never exceeded the highs of the 1940s as seen in Yosemite National Park. In fact her paper never analyzed local temperatures at all.

Parmesan relied on the political global warming bias. Parmesan was speaking globally, but butterflies always act locally. Ask any university ecology professor. They would not hesitate to harshly criticize an undergraduate term paper that used a “global average” to explain a local event; yet that was her only climate “evidence”.
Furthermore Parmesan failed to address the fact that higher temperatures enhanced the butterfly’s survival. Warm microclimates are critical for its survival. Caterpillars living in cooler microclimates develop more slowly, while those actively basking in the direct sunlight digest their food more quickly and grow more robustly. Cool rainy years often extirpated local populations.
Since the 1950s, Stanford University’s Paul Ehrlich and his colleagues had made detailed observations throughout the checkerspot’s habitat on the Jasper Ridge Preserve. They determined that the caterpillars must raise their body temperature an additional 18-21°F above ambient air temperatures. To raise their body temperature, caterpillars shuffled across the hillsides seeking life‑giving hotspots.4,5,6 Any global warming, natural or anthropogenic, should have been a benefactor, not an executioner.
Parmesan’s observations of extirpated populations were not new. Conservationists had sounded the extinction alarm years before her “global warming study”. Butterfly populations had diminished so quickly that the checkerspot’s apparent fate was compared to the rapid ruination of the extinct passenger pigeon. Scientists working to prevent extinction had always warned that the suburban sprawl from Los Angeles to San Diego had devoured the butterfly’s critical habitat and extirpated most populations.7,8 When the checkerspot’s southern California Quino subspecies was finally listed as endangered, conservation scientists wrote, “The basis for the listing was habitat loss, degradation, and fragmentation, recognizing additional negative effects from fire management practice. All factors are the results of intensive human economic development of ever diminishing resources.”60
The conservationists’ detailed studies also reported that most extinctions observed in southern California had already transpired by the 1970s, before any purported CO2 warming had significantly developed and furthermore populations were now recovering. In 2003 researchers wrote, “although we now know that the butterfly likely disappeared from Orange County thirty years ago, it was rediscovered in Riverside County in the early 1990s, and in San Diego County at several formerly occupied sites soon after.”8
Nor were extinctions limited to the southern end of the butterfly’s range. Rapid urban development entirely extirpated the Canadian subspecies (the Taylor checkerspot) from the coldest northern end of the butterfly’s range. But because there was a greater preponderance of extinctions in southern California, the “average statistical center” for the species migrated northward. There was never any evidence of any real migration due to warming. There was never an apocalyptic flight to cooler lands. Parmesan’s climate claim was solely a statistical fairy tale. Still Parmesan’s unscientific climate claim was published in one of the most prestigious scientific journals with one of the highest rejection rates, Nature.
How did Parmesan deal with the multitude of contradictory factors? Instead of a more detailed study, she simply argued, “the predicted effects of climate change will come, not from attempts to analyze all possible confounding variables in single studies such as this one, but from replication of this type of study.”1 In essence, by arguing that confounding factors were no longer important, she suggested we throw out the foundation of good scientific analyses. To demonstrate the negative impacts of climate change, all anyone needed to do was demonstrate that populations were dwindling in the south more than in the north, or dwindling more at lower elevations than at higher elevations. Implausibly, the prestigious journal Nature supported this “new climate science.”
Defying the Experts
The evidence against any CO2 connection was overwhelming, but I was no butterfly expert. Needing a reality check, I talked with my friend Dr. Paul Opler, one of North America’s top butterfly experts. If you have ever spent any time with Paul, you quickly realize that no one has a greater love for butterflies. If there was the smallest threat, he would be the first to speak out. In 1974, he was hired as the first invertebrate specialist for the United States Federal Endangered Species program. Virtually every butterfly species now listed as endangered was listed under his watch. To my great good fortune, he agreed to teach a course, “Butterflies of the Sierra Nevada” (which he still teaches), for my environmental education program each year. When he visited, I expressed my doubts about the legitimacy of Parmesan’s claims and my bewilderment at all the media hype, and I asked if he had seen any supporting evidence.
He carefully stated that from all the data he had perused, he had seen absolutely no evidence that any butterflies had ever moved northwards, nor had they been pushed to higher elevations. He added the checkerspot has now been discovered further south in Baja, Mexico. He too couldn’t understand the public fanfare and echoed my thoughts that “only her statistical averages moved, not the butterflies”. Due to his expertise, Opler had been invited by the Fish and Wildlife Service to comment on the proposed recovery plans for the subspecies in southern California and wrote:
The lengthy space given to Camille Parmesan’s study and the suggestion that newly found colonies are the result of global warming is highly speculative. Her study did not find new northern, or higher populations of the species. Her results were a statistical artifact of the purported loss of low-lying southern populations (emphasis added). Her surveys that showed the absence of butterflies in some population areas could have been carried out in relatively bad years when the species was present only as diapausing larval clusters. (Diapause is a period of dormancy similar to hibernation)
Opler was not the only expert to dissent. Other scientists, armed with detailed studies aimed at insuring the butterfly’s recovery and survival, also disagreed. “Our observation that human impacts were almost always involved in local extirpations in southern California (even for those areas that may seem to still have “suitable habitat”), the role of global warming as the proximate cause of extinction must be carefully evaluated. We suspect that warming is perhaps an exacerbating factor, but that increased extinction rates in southern California are primarily caused by more direct anthropogenic forces.”7
So I decided Parmesan’s landmark climate study needed to be replicated with a more critical eye on the contributing land use factors. However, when I looked for her methods section there was none. Her study had been published as a correspondence, and in Nature, a correspondence doesn’t require a methods section that allows for independent verification. That also explained how her paper survived a gauntlet of disagreement by leading experts. A correspondence is not typically peer reviewed. It is published simply based on the advocacy of Nature’s editors.
Withholding the Evidence
“We are trying to prove ourselves wrong as quickly as possible, because only in that way can we find progress.” -Dr. Richard Feynman, Nobel Prize in Physics
I emailed Dr. Parmesan and asked for the locations of the extinct populations. After months without reply, I called. Caught off guard, she initially refused to share any data, but after more discussion offered the possibility of collaboration. She said she needed to hang up but promised to send some data. More than three years later, I am still waiting. So much for Feynman’s good scientist “trying to prove ourselves wrong as quickly as possible.”
Her husband eventually responded to a follow-up email I sent a year later in which I expressed my frustration with their failure to allow independent verification. Her husband, Dr. Michael Singer, is a checkerspot expert who had shared in her research. Singer unintentionally confirmed Opler’s criticisms, “Her study did not find new northern, or higher populations of the species…There are no ‘new’ northern populations in Parmesan’s study. The study consisted entirely of re-examining populations known from past records and assessing which of them was currently extant or extinct. No ‘new’ populations were sought or found (emphasis added).” Trying to discourage my replication efforts Dr. Singer wrote, “But I do remember writing to you to say that E. editha has been increasing through the 2000s and that many of the populations that Camille and I recorded as extinct in the 1990s have been recolonized….So, any new census of Sierra Nevada populations would show a reduced correlation between elevation and population status, perhaps no longer a significant correlation.” Singer and Parmesan illustrate a glaring problem when limiting debate to peer-reviewed journals. Contradictory evidence is simply never published.
So why haven’t they published this good news of the butterfly’s recovery? Why did only her erroneous climate gloom and doom bring worldwide acclaim? Despite a wealth of evidence that contradicted global warming predictions, her faulty “Climate and Species Range” went viral and is now cited by over 580 articles. In contrast just 17 have cited the paper detailing conservationists’ efforts that actually saved the butterfly, “The Endangered Quino Checkerspot Butterfly”. Parmesan wrote subsequent papers blaming extreme weather and climate change for population extinctions and again withheld evidence of the species’ success. Likewise her half-truths were immediately embraced and published by our leading climate scientists and then cited by more than a thousand articles. That deception however requires a future essay.
https://wattsupwiththat.com/2013/07/14/fabricating-climate-doom-part-1-parmesans-butterfly-effect/
This really is a stunning account of malpractice, but it is not the only example that Jim Steele found.
He also identified serious problems with another Parmesan paper in 2000:
How the American Meteorological Society Justified Publishing Half-Truths
Background: In 2000, the Bulletin of the Meteorological Society published “Impacts of Extreme Weather and Climate on Terrestrial Biota” by Camille Parmesan, Terry Root, and Michael Willig. The paper introduced to the peer-reviewed literature analyses by Parmesan that extreme weather events had caused an extinction event in California’s Sierra Nevada and advocated the extreme weather was the mechanism by which global warming was driving animals northward and upward as Parmesan claimed in her first controversial paper discussed here. According to Google Scholar, the BAMS paper has been cited by 324 consensus articles. Thomson Reuter’s Essential Science Indicators report that by December 2009, Parmesan went on to be ranked #2 among highly cited authors for papers devoted expressly to global warming and climate change.
Below is a map of Parmesan’s study site first published in Singer, M., and C. D. Thomas (1996) Evolutionary responses of a butterfly metapopulation to human and climate-caused environmental variation. American Naturalist, vol. 148, p. S9–S39. I have added call out boxes. Notice how surgically “climate changed” supposedly killed individuals on the annual plant Collinsia (Xs) in the logged clearling while just a few feet away the same species was originally reported to be thriving on its normal host plant in undisturbed habitat. The observations of those thriving populations were later “amputated” from Parmesan’s extinction story that she spun in “Impacts of Extreme Weather and Climate on Terrestrial Biota

Parmesan et al biased their conclusion by omitting observations that all other individuals in the surrounding natural habitat had survived better than had ever been observed during the same weather events. Only the butterflies that had recently colonized a novel plant species in a highly disturbed logged area had been extirpated. If all observations were honestly presented, it would have been both an example of nature’s resilience and an example of the effect of landscape changes on microclimates. By omitting half of the data, their paper manufactured an illusion of extreme climate catastrophe as discussed here. So I requested an official retraction. It was no more honest than Enron officials leaving half the data off their books.
http://landscapesandcycles.net/American_Meterological_Society_half-truth.html
Needless to say, the AMS refused to retract.
With a track record like this, it is little wonder Parmesan has to go abroad for funding.
The Polar-Bear-Gate Saga: How a picture is worth a thousand lies – Paul Nicklen and Michael Mann vs Susan Crockford
By Jim Steele | Watts Up With That? | December 16, 2017
What oddly seems to surprise so many people, reality can quickly disagree with the hypotheses and speculative models of scientists. The polar bear is a rich case in point. In 2008, the polar bear was listed as threatened under the Endangered Species Act as a result of the Center for Biological Diversity’s (CBD) petition. Due to hypotheses regards future effects of increasing CO2 on sea ice and polar bear health, CBD argued polar bears were endangered. However then Interior Secretary Kempthorne made it clear that “the ESA will not be used as a tool for trying to regulate the greenhouse gas emissions blamed for creating climate change.” But as seen in other memos and petitions, such as for the bearded seals, the CBD ultimately wants to use the ESA as a tool to regulate CO2.
So the CBD stepped up their demands and petitioned the Obama administration to list the bears as endangered. Climate scientists Ken Caldeira and Michael Mann co-authored a 2010 letter to Interior Secretary Salazar supporting CBD efforts. They warned “sea ice has been projected to disappear in the 2030s or before” and lost sea ice was both a future and “current threat to this important habitat of the polar bear.” The Polar Bear Specialist Group (PBSG) led by researchers like Andrew Derocher, Steve Amstrup and Ian Stirling warned the world that “two thirds of the world’s bears will be lost by mid-century due to climate change”. The PBSG published a status table for all the polar bear sub-populations showing in the best studied populations, 8 were declining.
However, since 2010 those predictions have been unraveling. All the evidence now reveals polar bears are thriving and increasing, and the PBSG’s recent status tables show just that. Research by Chambellant and Stirling determined it was heavy springtime ice that was most detrimental to bears and their main prey, the ringed seal. The loss of Arctic summer sea ice was happening faster than CO2 driven models had predicted, suggesting flawed models. Research revealed that in response to the natural Arctic Oscillation, thick sea ice had been blown into the warmer Atlantic due to a directional shift in freezing winds. Further loss of Arctic sea ice has recently been shown to be caused by cycles of intruding waters from the Pacific and the Atlantic resulting in heat that gets stored in the subsurface of the Arctic Ocean, dynamics that have not been accurately incorporated into global climate models. Accordingly, the loss of sea ice has not accelerated. Instead the loss has slowed considerably.
Skeptics argued such evidence challenges prevailing hypotheses about the polar bears’ demise, and question the contention that greenhouse gases are the primary cause of sea ice fluctuations. Driven by the hubris of scientists like Michael Mann whose careers are totally invested in the “dire predictions” of rising CO2, the normal scientific process of challenging a hypothesis was framed as an “attack on science”.
Again in 2010, in the paper Climate Change and the Integrity of Science Peter Gleick wrote, “We are deeply disturbed by the recent escalation of political assaults on scientists in general and on climate scientists in particular. Accompanying his paper (below) was a photo-shopped picture of a polar bear stranded on a shrinking piece of ice. A deception that skeptics quickly pointed out.

So the following correction was placed in the paper’s online version.
“Due to an editorial error, the original image associated with this Letter was not a photograph, but a collage. The image was selected by the editors [of Science, the journal of the American Association for the Advancement of Science], and it was a mistake to have used it. The original image has been replaced in the online HTML and PDF versions of the article with an unaltered photograph from National Geographic.”
That replacement picture (below) was from National Geographic photographer Paul Nicklin, who would become infamous for specializing in dead and skinny polar bear photos. If Gleick or his editors were pulling photos from an archive (National Geographic ?) of photographs, then the question arises if the fake collage was also the work of the same photographer. And if so, for what purpose were they creating such a dishonest photo? The timing of the article and fake photo also raised suspicions from skeptics as it coincided with the Center for Biological Diversity’s campaign to up-list the polar bear from threatened to endangered,

Despite having “carelessly” used a fake photo, Gleick was anointed the Chairman of the new task force on “scientific ethics and integrity” for the American Geophysical Union in 2011. Leading by example, in 2012 Gleick was outed in a flagrant attempt to anonymously smear the Heartland Institute’s climate skepticism by disseminating documents dishonestly obtained, including a damning but forged memo. Quickly identified by internet skeptics, Gleick finally confessed. Although the forged document was only being disseminated by Gleick, he denied any hand in forgery, and there was not enough evidence to convict him of forgery. In a KQED interview, Michael Mann, likely motivated by self-protection, downplayed Gleick’s underhanded actions as “poor judgement”. Mann then argued the release of the climate-gate emails, emails that had exposed Mann’s own underhanded methods, was a more dastardly deed. To this day, it is still unknown if the release of climate gate emails were the work of a whistle-blower or a hacker.
However, consistent with Mann’s efforts to promote polar bears as an icon of catastrophic global warming, Mann expressed no concern about Gleick’s fake polar bear picture. Indeed Mann was actively trying to pull on heart strings by mewing in the CBD release, “When I ventured up to Hudson Bay in mid-November and saw the undernourished polar bears with their cubs, sitting around at the shore of the Hudson Bay, waiting for the then month-overdue sea ice to arrive so they could begin hunting for food, it suddenly came home for me. For the first time in my life, I actually saw climate change unfolding before my eyes. It was a sobering moment, and one I’ll never forget.” In contrast to such storytelling, the unpublished research data from Stirling and Lunn, determined polar bear’s Body Condition Index for Hudson Bay bears had been improving since 1998 (in Landscapes and Cycles, p. 217). Improving body condition was also consistent with the increasing number of Hudson Bay bears estimated in subsequent surveys.
Susan Crockford runs the website polarbearscience.com, that aggregates the most up-to-date, peer-reviewed science and media releases by polar bear researchers. For example, Crockford reported the latest survey showing a healthy rebounding Western Hudson Bay population, months before the Polar Bear Specialist Group (PBSG) researchers publicized the increase. The PBSG had incorrectly predicted a dramatic decline in Hudson Bay bears, so their tardiness to expose their own shortcomings is understandable. Crockford also reported the lack of consensus among polar bear researchers. While Enviornment Canada agreed with the latest survey that estimated a healthy 1,030 Western Hudson Bay bears, PBSG alarmist Andrew Derocher was actively pushing a much lower estimate of 800 bears to the media and suggesting the bears were doomed. This too is understandable as Derocher was invested in his earlier predictions that “by the middle of this century, two-thirds of the polar bears will be gone from their current populations”
Nonetheless despite multiple surveys suggesting polar bear abundance was and is increasing, others tried to deny the evidence and suggest bears were starving and still on the brink of extinction. In 2015, photos by Kerstin Langenberger and once again by Paul Nicklin were pumped on social media, suggesting bears were suffering from a climate catastrophe. Who were these photographers?

The dying bear above was put on Facebook by Kerstin Langenberger whom internet articles referred to as just a German photographer. But a little digging revealed she is a Greenpeace activist, which is consistent with her catastrophic narratives that accompanied her photo and contradicted our best science. She stated, “With the pack ice retreating further and further north every year, they tend to be stuck on land where there’s not much food,” and “many times I have seen horribly thin bears, and those were exclusively females – like this one here” and “Only once I have seen a bear getting a big fat ‘5,’ but several times I have seen dead bears and bears like this one: a mere ‘1’ on the scale, doomed to death.” [polar bears’ body condition is often rated from 1(dangerously thin) to 5 (fat)].
However contradicting Langenberger’s narrative, Norwegian Polar Institute researcher Kit Kovacs stated there’s reason to question claims that the number of animals experiencing such hardships is increasing. Our monitoring work indicates that (on-average) bears in the Svalbard population have NOT declined in condition over the last two decades – based on male body masses and fat levels”. Similarly, in the South Beaufort Sea population, female body condition had improved despite reduced summer ice.

Also in 2015, Nicklin posted his photo of a dead bear that went viral. Journalist Andrew Freedman promoted the picture in Mashable writing, “Global warming may have led to the death of this polar bear.” Presenting a thin veneer of objectivity, he quotes polar bear researcher Ian Stirling who suggested that Nicklen’s photo shows a bear that most likely, but not certainly, died as a result of starvation related to sea ice melt. But Stirling’s remarks must be taken with a grain of salt as there is absolutely no evidence to support why the bear died. Furthermore, Stirling has appeared slightly schizophrenic lately as has been detailed. For example despite his research showing cycles of heavy spring ice had been most detrimental to seals and bears, Stirling and Derocher’s review of polar bear “science” used the very same research to falsely imply that less summer ice was the problem.
In contrast to those 2015 photos, Crockford’s website was one of the few places where scientific reports of a healthy bear population could be found. Contradicting Langenberger and Nicklin’s story-telling of dead bears strewn across Svalbard due to climate change, Crockford posted links to actual researchers from the Norwegian Polar Institute who reported fat bears in Svalbard.
Researchers were reporting:
“The polar bears on Svalbard is round and full, thanks to a good [ice year] and good hunting opportunities.” And “… Polar bears were fat, many looked like pigs”, says polar researcher at the Norwegian Polar Institute, Jon Aars to the High North News. Furthermore the Svalbard bears are part of the Barent Sea population and in 2017 Crockford relayed the most recent survey data showing Barent Sea Bears have been increasing. But such facts don’t have the emotional appeal as Nicklin’s fanciful pictorial story telling.

The Polar Bear Specialist Group (PBSG) had created a status table in 2009 to illustrate the trends of each polar bear population. Above is their 2010 version. The trends are boldly shown in red for declining and green for stable or increasing populations. Eight populations were believed to be declining of which 6 were considered very likely to decline further. Only 3 populations were considered stable and only 1 was increasing. These declining PBSG estimates also went viral, and websites such as the one run by psychologist John Cook, who is now part of the well-funded Center for Climate Change Communication, posted an article concluding, “Current analysis of subpopulations where data is sufficient clearly shows that those subpopulations are mainly in decline” and thus support the ESA listing of polar bears as threatened. In contrast in Landscapes and Cycles I documented how bear populations since 2010 were definitely increasing based on latest research. That analysis has been confirmed while earlier PBSG hype of declining populations and speculation of coming extirpations have not survived the test of time.
Fortunately Susan Crockford’s Polar Bear Science blog has continuously discussed population trends as reported by bear experts plus PBSG’s status updates. While the PBSG removes their old tables, Crockford’s website serves as an archive that allows the public to readily witness how the bears have been increasing. For example the 2014 table (below) revealed the good news that only 3 of the past 8 populations were still declining, one was still increasing, and the stable populatons had doubled to 6.
Oddly in 2017 the PBSG eliminated the trends from their population table. The most likely reason for this omission would be that none of the bear populations are currently declining. Every population would be green or data deficient. Despite rising CO2 and reduced summer sea ice, polar bears are doing quite well and that contradicted the their predictions.
Of the 3 previously declining populations listed in their 2014 status report, the Baffin Bay population has now increased from 1,546 in 2004 to 2,826 in the most recent survey. The Kane Basin bears, that suffer from heavy ice, were estimated at 167 in 1997 but rose to 357 in 2014. The South Beaufort Sea population estimation remained unchanged but this population has been heavily criticized for poor analyses of mark and recatpure data.


In the face of rapid increases in the Baffin Bay bear population, a social media splash of Nicklin’s starving bear on Baffin Island appears to be another orchestrated attempt to resuscitate the failing claim that climate change is killing bears. National Geographic who sponsored Nicklin reports by “telling the story of one polar bear, Nicklen hopes to convey a larger message about how a warming climate has deadly consequences.” The NY Times pushed the video with similar headlines: Video of Starving Polar Bear ‘Rips Your Heart Out of Your Chest’. The Washington Post hyped the bear as evidence of an environmental disaster with the headlines, ‘We stood there crying’: Emaciated polar bear seen in ‘gut-wrenching’ video and photos. If you searched the internet for an objective scientific examination, oddly no matter how many variations of “starving polar bears” are queried Google’s first link brings up the WWF’s plea for money to save the bears, and perhaps a violation of net neutrality.
Snopes who advertises itself as a fact-checker of truth, rated Nicklin’s starving bear video as “TRUE”. But Snopes’ bias is revealed by its discussion on the photo’s relevance, which pushes catastrophic climate change speculation. Snopes quotes polar bear researcher Steve Amstrup, who has flip flopped on several bear issues over his career and whose “expertise model” has been severely criticized by colleagues in released emails. Amstrup promotes the starving bear photo on his website, again with the obligatory thin veneer of objectivity stating, “we cannot say, from the footage captured here, that this bear’s malnutrition was caused by global warming and its associated sea ice loss”. He then launches his speculative catastrophic message, “The problem is that an ever-warmer future means polar bears will have less and less access to their seal prey, so the rate at which bears die from malnutrition/starvation will increase. So, regardless of the proximate cause of this bear’s condition, this heart-wrenching footage provides us with a warning about the future.” Yet not a word about the survey of Baffin Bay bears robustly increasing from 1,546 in 2004 to 2,826 today.

Amstrup and Mann are facing an embarrassing professional dilemma. With all the polar bear populations increasing or stable, their predictions that two-thirds of the polar bears will be gone by the middle of this century appears destined for utter failure. They had to do something. Otherwise who would trust a doctor whose past diagnoses were absolutely wrong. So, Harvey, Stirling, Amstrup, Mann and a professor of psychobabble Stephan Lewandowsky, banded together as coauthors of the paper Internet Blogs, Polar Bears, and Climate-Change Denial by Proxy that fortuitously gets publicized alongside Nicklin’s starving bear hype.
Their paper acknowledges observations that polar bears have yet to be harmed writing, “Although the effects of warming on some polar-bear subpopulations are not yet documented and other subpopulations are apparently still faring well.” But they then confuse speculation with proven facts by suggesting “the fundamental relationship between polar-bear welfare and sea-ice availability is well established.” Clearly the growing bear populations present an undeniable challenge to any belief in the “requirement” of summer ice.
Their paper argued, “a growing body of scientific research reports the wide array of negative effects of AGW on biodiversity” by citing Parmesan whose bogus claims about the negative effects of climate change on wildlife are well documented. Harvey, Stirling, Amstrup and Mann confuse speculative hypotheses with “fundamental relationship”. Published observations have shown heavy springtime ice is more harmful for seals and bears. Observations by Arrigo determined that reduced ice, whether natural or anthropogenic, has increased phytoplankton productivity and bolstered the Arctic food web, while fishery researchers find that less ice and warmer temperatures increase Arctic cod abundance that is required to sustain the seals that sustain the bears.
Because skeptic websites like Crockford’s polarbearscience.com, Anthony Watts’ WUWT, and many others are the best source for alternative explanations that challenge catastrophic hypotheses, they are denigrated by these supposed objective scientists. As mounting evidence continues to turn against their prior polar bear predictions Harvey, Stirling, Amstrup, Mann and Lewandowsky’s were running low on scientific ammunition. So now they chose to publish a paper, solely aimed at shooting the messengers. They offered no scientific facts about polar bears that contradicted anything Crockford had published. Their arguments were based solely on the fallacy of authority, authorities whose predictions are failing. Their paper is nothing more than a smear campaign hoping to suppress the upwelling call for more debate. Such tactics, tactics that try to obscure any evidence that challenges a failing hypothesis, are the real attacks on the scientific process. That is why Mann has been labeled by some as a disgrace to the profession. And whether or not Nicklin’s latest wretched polar bear photo is part of an orchestrated attempt to resuscitate their failed predictions, the media hype reveals that such photos, taken out of context, are worth a thousand lies.
Jim Steele is Director emeritus Sierra Nevada Field Campus, San Francisco State University and author of Landscapes & Cycles: An Environmentalist’s Journey to Climate Skepticism
Global Temperature Trends Based On Non-Existent Data
By Paul Homewood | Not A Lot Of People Know That | November 28, 2017

https://www.metoffice.gov.uk/hadobs/hadcrut4/diagnostics.html
We are all too familiar with graphs showing how much global temperatures have risen since the 19thC.
The HADCRUT version above is typical, and also very precise, with fairly tight error bars even in the early part of the record.
One wonders where they got the data to work all this out, because it certainly could not have come from thermometers.
All of the major global temperature datasets rely heavily on the Global Historical Climatology Network (GHCN). Yet as the “Overview of the Global Historical Climatology Network-Daily Database”, published by Matthew Menne et al in 2012, rather inconveniently showed, most of the world had little or no temperature data in the 19thC, and even up to 1950.

Density of GHCN-Daily stations with daily maximum and minimum temperature
http://journals.ametsoc.org/doi/full/10.1175/JTECH-D-11-00103.1
Prior to 1950, there were no more than a couple of hundred or so of GHCN stations outside of North America:

There are many competent scientists and statisticians who believe that even now it is not possible to measure the Earth’s average temperature, indeed that it is a meaningless concept.
Whether they are right or not, no serious scientist would claim to know the global temperature a century or more ago.
The big slide in renewable energy tells the real story
No, renewables are not taking over the world anytime soon.
By Bjørn Lomborg | Watts Up With That? | November 26, 2017
We have spent the last two centuries getting off renewables because they were mostly weak, costly and unreliable. Half a century ago, in 1966, the world got 15.6% of its energy from renewables. Today (2016) we still get less of our energy at 13.8%.
With our concern for global warming, we are ramping up the use of renewables. The mainstream reporting lets you believe that renewables are just about to power the entire world. But this is flatly wrong.
The new World Energy Outlook report from the International Energy Agency shows how much renewables will increase over the next quarter century, to 2040. In its New Policies Scenario, which rather optimistically expects all nations to live up to their Paris climate promise, it sees the percentage increase less than 6 percentage points from 13.8% to 19.4%. More realistically, the increase will be 2 percentage points to 15.8%.
Most of the renewables are not solar PV and wind. Today, almost 10 percentage points come from the world’s oldest fuel: wood. Hydropower provides another 2.5 percentage points and all other renewables provide just 1.6 percentage points, of which solar PV and wind provide 0.8 percentage points.
Neither will most renewables in 2040 come from solar PV and wind, as breathless reporting tends to make you believe. 10 percentage points will come from wood. Hydropower provides another 3 percentage points and all other renewables provide 6 percentage points, of which solar PV and wind will (very optimistically) provide 3.7 percentage points.
Oh, and to achieve this 3.7 % of energy from solar PV and wind, you and I and the rest of the world will pay – according to the IEA – a total of $3.6 trillion in subsidies from 2017-2040 to support these uncompetitive energy sources. (Of course, if they were competitive, they wouldn’t need subsidies, and then they will be most welcome.)
Most people tend to think about electricity for renewables, but the world uses plenty of energy that is not electricity (heat, transport, manufacture and industrial processes).
Actually, if the world miraculously could make the *entire* global electricity sector 100% green without emitting a single ton of greenhouse gasses, we would have solved just a third of the total global greenhouse gas problem.
As Al Gore’s climate adviser, Jim Hansen, put it bluntly:
“Suggesting that renewables will let us phase rapidly off fossil fuels in the United States, China, India, or the world as a whole is almost the equivalent of believing in the Easter Bunny and [the] Tooth Fairy.”
We need to get real on renewables. Only if green energy becomes much cheaper – and that requires lots of green R&D – will a renewables transition be possible.

References
Data for graph: “A brief history of energy” by Roger Fouquet, International Handbook of the Economics of Energy 2009; IEA data DOI: 10.1787/enestats-data-en, and World Energy Outlook 2017, unfortunately not free, https://www.iea.org/weo2017/
Hansen quote: http://www.columbia.edu/…/mail…/2011/20110729_BabyLauren.pdf
The world emitted 49Gt CO₂e in 2014, and all electricity/heat came to 15Gt or less than a third, http://cait.wri.org/profile/World.
Deconstructing the Climate Demagoguery of the Wine Country Wildfire Tragedies
By Jim Steele | Landscapes and Cycles | October 25, 2017
As sure as the winds will blow, climate demagogues hijack every human tragedy to amplify fears of rising CO2 concentrations. Despite that fact other critical factors were keys to understanding the devastation of the Wine Country fires, politicians like Hillary Clinton, Al Gore and Governor Jerry Brown were quick to proclaim climate change had made the fires worse than they would have been.
Climate researcher Kevin Trenberth has long tried to undermine the foundations of science by discarding the null hypothesis. Without formal testing whether a tornado, hurricane or wildfire event is within the expectations of natural variability, Trenberth simply asserts every tragedy is made worse by rising CO2. Accordingly, he is interviewed by climate change propagandists after every weather tragedy. In an interview with InsideClimateNews a few months before the Wine Country wildfires Trenberth continued to proselytize his views, “Whatever conditions exists, they’re always exacerbated by climate change. There’s always that heat variable, the increased risk.”
Indeed heat is always a variable, but usually it has nothing to do with CO2. Sadly, due to his extreme beliefs Trenberth often confuses climate with weather.
Similarly, Daniel Swain who authors a good California Weather Blog, unfortunately strays when he tries to interject CO2-climate change into an otherwise good weather analysis. Writing the fires should also be looked at from “the long-term climate context,” he argued the “record-hottest summer” dried out the vegetation exacerbating the fire conditions. But he too failed to separate natural climate and weather events from his hypothesized contributions from CO2. As will become clear from a more detailed analysis, climate change played no part in the wildfire devastation.
The Ignition Component
Fire danger rating systems analyze 1) an ignition component, 2) a fuel component and 3) a spread component to determine how to allocate fire-fighting resources and when to issue public alerts. Natural fires are caused by lightning, and so good weather models can forecast the short-term probability of lightning fires. Lightning fires are also more likely during warm and moist seasons enhancing their window of predictability. Unfortunately, Cal Fire reports 95% of California fires are unpredictably ignited by humans.
Climate alarmists like Dr. Trenberth have blithely suggested global warming is increasing the fire season stating, “In the West, they used to talk about a fire season, the fire season used to be 60 days, then 90 days, and now they think it’s year-round. There’s no pause.” Tragically that uncritical belief in a climate-related extended fire season has been parroted by lay person and scientists alike. But the facts show the observed extended fire season is due to human ignitions. Blaming climate change is fake news!
In a 2017 paper researchers reported that across the USA from 1992 to 2012, “human-caused fire season was three times longer than the lightning-caused fire season and added an average of 40,000 wildfires per year across the United States. Human-started wildfires disproportionally occurred where fuel moisture was higher.” Furthermore “Human-started wildfires were dominant (>80% of ignitions) in over 5.1 million km2, the vast majority of the United States, whereas lightning-started fires were dominant in only 0.7 million km2.”
We can reduce some human caused ignitions. The Wine Country fires were not ignited by lightning but all observations suggest they were started by downed power lines in high winds. A year ago, California legislators introduced a bipartisan bill aimed at reducing wildfire ignitions from powerlines. Although governor Brown hypes the unsubstantiated dangers of climate change, he vetoed the bill which would have promoted real action to prevent well-known human causes of wildfires. Preventing powerline ignition could have prevented the Wine Country tragedy.
The Fuel Component
Fire ecologists will estimate a fire’s potential intensity by calculating the Energy Release Component (ERC), a measure of the potential heat energy per square foot. ERC is a function of the biomass both dead and alive, and the biomass moisture content. As fuels increase and as fuels dry the ERC increases. Live fuels are modeled such that maximum moisture content coincides with the peak growing season, and declines thereafter as the plants go dormant. Moisture content of dead fuels are modeled according to their diameters.
Depending on their diameters, dead fuels will lose moisture as they equilibrate with their dry surroundings at rates that vary from 1 hour to 1000 hours or more. To aid in firefighting management decisions, fuels are categorized into 4 groups as described in Gaining an Understanding of the National Fire Danger Rating System published by the National Wildfire Coordinating Group
1-Hour Time-lag Fuels “consist of herbaceous plants or round wood less than one-quarter inch in diameter. Also included is the uppermost layer of litter on the forest floor.” The ERC of these fuels and thus the fire danger, can change throughout the day. Dead grass as well as twigs and small stems of chaparral shrubs are 1-hour fuels, and those fine fuels sustained the rapid spread of the Wine Country fires. Assertions that recent and past summer droughts or decades of climate change had dried the fuels and exacerbated the Wine Country fire danger have absolutely no scientific basis. The approach of the hot, bone-dry Diablo Winds would have extracted all the possible moisture from the dead grasses and chaparral twigs within hours, regardless of past temperatures. Trenberth and Swain simply confused rapid weather changes with climate change.
The critical “long-term context” they never discussed is that a century of fire suppression allowed destructive levels of fuel loads to develop, increasing the biomass component of the ERC estimate. As populations grew, so did the demand to suppress every small fire that could threaten a building. Natural small fires reduce the fuel load, whereas fire suppression allows fast drying fuels to accumulate. Unfortunately, fire suppression only delays the inevitable while stocking more fuel for a much more intense blaze. Local officials and preservationists have long been aware of this problem, and controlled burns to reduce those fuels were being increasingly prescribed. Tragically, it was too little too late.

Figure 1: A prescribed control burn in Wine Country
10-Hour Time-lag Fuels are “dead fuels consisting of round wood in the size range of one quarter to one inch in diameter and, very roughly, the layer of litter extending from just below the surface to three-quarters of an inch below the surface.” The fuel moisture of these fuels vary from day to day and modeled moisture content is based on length of day, cloud cover or solar radiation, temperature and relative humidity.
100-Hour Time-lag Fuels are “dead fuels consisting of round wood in the size range of 1 to 3 inches in diameter and, very roughly, the forest floor from three quarters of an inch to four inches below the surface.” Moisture content of these fuels are also a function of length of day (as influenced by latitude and calendar date), maximum and minimum temperature and relative humidity, and precipitation duration in the previous 24 hours.
Much of the chaparral shrubs produce twigs and stems in size ranges of the 1-hr, 10-hr and 100-hr fuels. These fuels were most likely the source of burning embers that high winds propelled into the devastated residential areas. Again, these dried out fuels are the result of a natural California summer drought and short term weather conditions such as the bone-dry Diablo Winds that arrive every year.

Figure 2 Moisture content of 3-8 inch diameter fuels from March to December
1000-Hour Time-lag Fuels are “dead fuels consisting of round wood 3 to 8 inches in diameter or the layer of the forest floor more than about four inches below the surface or both”. These larger fuels are more sensitive to drought conditions that existed months earlier, so it could be rightfully argued that a hotter drier July and August made these fuels more flammable in October and exacerbated the fires.
Fire ecologists planning prescribed burns to reduce fuel loads, wait until the 1000-Hr fuels’ moisture content is reduced to 12% or lower. If these larger fuels are dry, it is certain the smaller fuel categories are dry as well, so that all fuels will be highly flammable. As seen in the graph above (Figure 2) 1000-hr fuels reach that critical dryness threshold by July 1st and remain below that threshold until mid-October when the rains begin to return. Contrary to Trenberth’s blather, California’s fire season has always lasted 90+ days. Undoubtedly the unusually hot and dry 2017 summer would have lowered 1000-hr fuel moisture content even further. Nonetheless those fuels become naturally flammable every summer. Furthermore, these larger fuels were less often burned and thus insignificant factors in regard to the fires rapid spread. The rapid spread of the fires was due to consumption of the rapidly drying fuels.
Swain is fond of finding a “record setting” metric to bolster his climate change assertions. As such, he noted the “record-hot summer had dried out vegetation to record levels” and linked to a graph tweeted by John Badoglio showing October ERC values for the past 30 years were at a record high in 2017 (in part because of delayed rains). However, that “record” was also largely irrelevant. The ERC calculation is heavily biased by the greater biomass of the larger 1000-hr fuels that would indeed get drier as the autumn continued without rain. Still those larger fuels were insignificant contributors to the rapidly spreading fire. As seen below (Figure 3), the grasses have been entirely burnt while the larger shrubs and trees, as well as the woody debris near the base of the trees (in the upper left) have not been consumed. In fact many of the trees are still alive. The potential energy estimated by the “record ERC” was only partially realized. It was the fast-drying dead grass and chaparral shrubs that turned potential ERC into meaningful fiery heat.

Figure 3
The Spread Component
“The spread component is defined as “the theoretical ideal rate of spread expressed in feet-per-minute.” Wind speed, slope and fine fuel moisture are key inputs in the calculation of the spread component, thus accounting for a high variability from day-to-day.” Thus, a combination of dry fuels and high winds typically result in fire-watch and red-flag warnings one day and no warnings days later as the winds subside. Forest rangers are well aware that September and October bring the powerful Diablo Winds of Santa Rosa as well as the Santa Anas of southern California, and with those winds comes the highest fire danger.
Cliff Mass is an atmospheric scientist at the University of Washington and author of the superb Cliff Mass Weather and Climate blogs. An October 16th post provides an excellent summary of the metorological conditions that created the fierce winds driving the Wine Country fires. In essence, a strong approaching wind flow (the Diablo Winds) coupled with a thermal inversion near the top of the mountains that border the Santa Rosa valley, accelerated winds into a 60 to 90 mile per hour downslope wind event, a phenomenon known as a mountain wave. Those high winds snapped power line poles and ignited fires. The regional topography also funneled the winds and fire down the valley, taking dead aim at the heart of Santa Rosa. The topography had guided a similar fire in 1964, the Hanley fire, which was started by a carelessly discarded cigarette. Unfortunately without much concern, most of the burnt homes in the Tubbs fire had been built on top of the burnt grounds of that previous Hanley fire, despite public protests.
Were those high winds perhaps exacerbated by climate change? Highly unlikely!
The Diablo Winds affecting Santa Rosa or the Santa Annas of southern California are driven by cooling seasonal temperatures in the high deserts to the east. The inner continent cools faster than the oceans, setting up a pressure gradient driving the winds toward the coast. The winds then heat adiabatically rising 5 degrees Celsius for every 1000 feet of elevation descent. An adiabatic rise in temperature means no added heat from any source and basic physics tells us temperatures can rise adiabatically simply due to compression. Thus an air mass that originated near Flagstaff Arizona at a 6,900 foot elevation, could adiabatically warm by 30 degrees as it reaches sea level.
The flow direction of winds are largely driven by unequal seasonal changes in temperatures. During the summer the interior heats faster than the oceans, such that a cooling onshore wind reduces interior temperatures. This pattern reverses in the autumn as the interior lands cool faster than the ocean creating an inland high pressure that drives the Diablo and Santa Anna winds toward the coast. Despite declining solar insolation, this autumn wind flow causes coastal California to experience some of its hottest days of the year in September and October, commonly referred to as Indian summer. Similarly a pressure system that inhibited the cooling onshore winds around San Francisco, resulted in a record hot summer temperature. By simultaneously opposing cooling sea breezes while bringing warm winds that were adiabatically 5 to 10 degrees warmer, temperatures rise and relative humidity falls. The result is bone-dry hot Diablo winds that suck the moisture from land and vegetation wherever the winds pass.
To restate the forces driving the winds, the Diablo winds are the result of a pressure gradient resulting from an interior that cools cooler faster than the ocean. If CO2 is warming the earth to any significant extent, then we would expect that warming to prevent the inner continent from cooling as quickly as it did decades ago. Thus CO2-global warming would predict a decline in that pressure gradient and a weakening of these winds.
To summarize, none of the fire components- ignition, fuels, or spread – had been affected by climate changes.

Finally, keen observers will notice that entire blocks of houses, and entire neighborhoods were completely burnt to the ground, in contrast to neighborhood trees that often remained relatively unscathed. This suggests that the high winds rapidly carried burning embers from the grassland and chaparral into these developments. While the trees did not trap the embers, the buildings did. I would expect we will soon hear about investigations inquiring into why these residences were not required to erect more fire safe structures, especially when built in a known fire-prone habitat in a high wind corridor. The simple requirement of constructing eaves in such a manner that prevents the trapping of burning embers and fire-proof roofs may have saved many homes.
Indeed there are many lessons that will allow us to prevent such wildfire disasters in the future if we have accurately determined the causes of these fires. Cliff Mass notes that our short-term weather models had accurately predicted the time and place of the fiercest winds. That information could be used to temporarily shut down the electrical grid where power lines are likely to ignite fires. We can bury power lines below ground. We can remove the high fuels loads that accumulated during a century of misguided fire suppression. Insurance companies can demand higher rates unless proven precautions are undertaken. It is those lessons that Gore, Clinton, Brown should be promoting to inform the public. Trenberth and Swain should be informing the people of the natural weather dangers that are inevitable. There is no evidence that climate change, whether natural or anthropogenic, exacerbated the ignition, fuels or spread components of these deadly fires. And worse, their obsessed belief that rising CO2 concentrations worsen every tragedy only distracts our focus from real life-saving solutions.
Jim Steele is Director emeritus Sierra Nevada Field Campus, San Francisco State University and author of Landscapes & Cycles: An Environmentalist’s Journey to Climate Skepticism
Scientists and media continue to spread misinformation about polar bears & walrus
BY Susan Crockford | Polar Bear Science | November 5, 2017
“Lies” might be a better word to characterize the misinformation that scientists and the media have been busy spreading to the public over the last few weeks. The information is either known to be false (by scientists whose job it is to relay facts honestly) or is easily shown to be false (by journalists whose job it is to fact-check their stories).

Polar bear misinformation
Earlier this month, biologist Nick Lunn was interviewed by the CBC and for the news program The National. He stated outright, without qualification, that Western Hudson Bay polar bear numbers have dropped from about 1200 (in 1987) to about 800 now (a 33% decline).
However, it is not scientifically appropriate to compare these figures because they were based on different types of surveys conducted over different portions of the region (they are also statistically insignificant). Lunn should know better because the published reports (Dyck et al. 2017; Stapleton et al. 2014; Lunn et al. 2016) make it clear these numbers are not comparable.
The official Western Hudson Bay estimate accepted by the PBSG in 2014, and by the IUCN in 2015, is 1030 bears (range 754-1406), based on the survey conducted by Stapleton and colleagues in 2011. Environment Canada considered the subpopulation ‘likely stable’ in 2014, an assessment upheld by the 2016 survey.

Because even the 2011 and 2016 Western Hudson Bay aerial surveys used somewhat different methods, the only population size numbers (subsets of each total) that can be compared are these:
2011 (949, range 618-1280)
2016 (842, range 562-1121)
The slight apparent decline over 5 years (11%) was not statistically significant (Dyck et al. 2017, pg. 3, 37) and is therefore equivalent to no change.
Similarly, when differences in methodology and statistical significance are taken into account, the estimate for 2016 cannot be said to be different from the 2011 estimate of 1030 bears (Stapleton et al. 2014), which was not statistically different from the estimate of 935 (range 794-1076) calculated in 2004 (Regehr et al. 2007).
‘Likely stable’ is probably the best way to characterize this result.
However, biologist Andrew Derocher has also been guilty of misrepresenting the facts on the Western Hudson Bay population status over the last few weeks:
Western Hudson Bay #polarbears decline >30% & Nunavut increases harvest quota. “almost impossible, to recommend” says Wildlife Director. pic.twitter.com/ogdqZ14HhW
— Andrew Derocher (@AEDerocher) November 3, 2017
And…
Aerial surveys ==> large confidence intervals & we'd need > 50% decline for statistical significance. Not precautionary management to wait https://t.co/cMw61Rwg71
— Andrew Derocher (@AEDerocher) September 14, 2017
— Andrew Derocher (@AEDerocher) September 14, 2017
And…
Western Hudson Bay #polarbear population dropped from 1030 bears to 842 over 2011-2016. 18% decline. Not “slight”. https://t.co/AoVSqWSQjw pic.twitter.com/tmlgYlZ3a1
— Andrew Derocher (@AEDerocher) September 14, 2017
Bottom line: The 2011 estimate of 1030 cannot be compared to the 2016 estimate of 842 (or to the 1987 estimate of 1200) because these numbers were generated using different methods. Lunn and Derocher know this: it’s their job to know. But it’s their job to honestly relay scientific facts to the public, not an interpretation of those facts they’d prefer to be true.
Ironically, all this hype is being promoted as Hudson Bay seems gearing up for the earliest freeze-up in decades (here, here, and here).
In the chart below, grey ice (dark purple) is thick enough for an adult male polar bear to walk on. The new ice could still get blown out into the bay if the wind is right (from the south) but that does not seem likely under conditions of freezing cold temperatures, snow, and west and northwest winds at Churchill (for 5-8 November).

Walrus misinformation
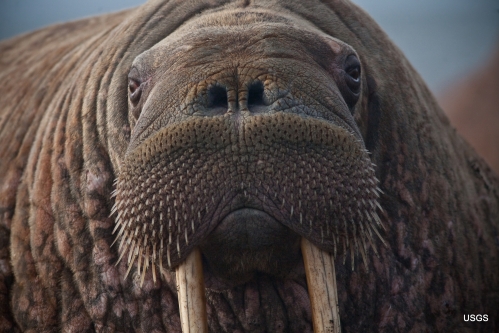
Here is Christopher Booker (The Telegraph, 4 November 2017) on the walrus nonsense being told by the BBC via its news body and its documentary series, “Blue Planet II”.
“… the BBC yet again [claimed] that Arctic ice is rapidly vanishing, supported on BBC News by a clip from David Attenborough’s Blue Planet II series, intoning that, among species most “seriously affected” by global warming, are walruses, showing hundreds of them desperately squeezing on to a melting ice floe.
But there are one or two little problems with this BBC version of the facts. First, far from Arctic ice vanishing, there has been no further downward trend in the extent of its summer melting since 2006. Its lowest point this September was higher than in seven of the past 11 years.
The US Fish and Wildlife Service has found that there are so many more of them than there were 30 years ago that last month that it decided not to list Pacific walruses on its endangered species list.
Secondly, far from walruses being “seriously affected”, an exhaustive survey by the US Fish and Wildlife Service has found that there are so many more of them than there were 30 years ago that last month that it decided not to list Pacific walruses on its endangered species list.
Thirdly, what produced that 2016 spike in CO2 and global temperatures was not “human activity” but the unusual warming of the Pacific Ocean by an abnormally strong El Niño. It is this warming that causes the oceans to “outgas” more CO2, not the CO2 that causes the warming: as even the BBC was told when, in July last year, its website quoted the Met Office under the heading “El Niño likely to boost CO2 in 2016”.
Since that El Niño ended, however, the latest Met Office data show that ocean temperatures have dropped sharply, with global surface temperatures back to where they were in 2002. Which is why the BBC’s reporting of all this last week could scarcely have been a better example of what it likes to scorn as “fake news”.
I couldn’t have said it better myself, except to add that Atlantic walrus, which the Blue Planet II folks filmed for their documentary, also show no evidence of being negatively impacted by climate change or sea ice loss so far.
Such disgraceful journalist practice is no better than the reaction of the CBC Radio here in Canada last month (4 October) to the news that the USFWS would not list walrus as ‘threatened.’
Instead of getting a scientist on to explain to listeners the science backing the decision, it had a spokesperson from the litigious Centre for Biological Diversity advocacy organization on the show to present a boring and quite predictable rant about why she disagreed with the decision. Of course she’s disappointed: she authored the document that forced the USFWS to consider the listing!
Bottom line: Have journalists forgotten how to do their jobs or do they really believe their opinions on certain subjects give them free license to ignore the ethics of their profession?
Actually, I could ask the same question about the polar bear specialists.
References
Dyck, M., Campbell, M., Lee, D., Boulanger, J. and Hedman, D. 2017. 2016 Aerial survey of the Western Hudson Bay polar bear subpopulation. Final report, Nunavut Department of Environment, Wildlife Research Section, Iglolik, NU. http://www.gov.nu.ca/environnement/information/wildlife-research-reports#polarbear
Lunn, N.J., Servanty, S., Regehr, E.V., Converse, S.J., Richardson, E. and Stirling, I. 2016. Demography of an apex predator at the edge of its range – impacts of changing sea ice on polar bears in Hudson Bay. Ecological Applications, in press. DOI: 10.1890/15-1256
Regehr, E.V., Lunn, N.J., Amstrup, S.C. and Stirling, I. 2007. Effects of earlier sea ice breakup on survival and population size of polar bears in Western Hudson Bay. Journal of Wildlife Management 71:2673-2683.
Stapleton S., Atkinson, S., Hedman, D., and Garshelis, D. 2014. Revisiting Western Hudson Bay: using aerial surveys to update polar bear abundance in a sentinel population. Biological Conservation 170:38-47. http://www.sciencedirect.com/science/article/pii/S0006320713004618#
‘A Deceptive New Report on Climate’
By Judith Curry | Climate Etc. | November 3, 2017
Red-teaming the the U.S. government’s Climate Science Special Report on the topic of sea level rise.
Steve Koonin has a new op-ed in the WSJ : A Deceptive New Report on Climate, that clarifies the need for a Climate Red Team. Excerpts:
One notable example of alarm-raising is the description of sea-level rise, one of the greatest climate concerns. The report ominously notes that while global sea level rose an average 0.05 inch a year during most of the 20th century, it has risen at about twice that rate since 1993. But it fails to mention that the rate fluctuated by comparable amounts several times during the 20th century. The same research papers the report cites show that recent rates are statistically indistinguishable from peak rates earlier in the 20th century, when human influences on the climate were much smaller. The report thus misleads by omission.
This isn’t the only example of highlighting a recent trend but failing to place it in complete historical context. The report’s executive summary declares that U.S. heat waves have become more common since the mid-1960s, although acknowledging the 1930s Dust Bowl as the peak period for extreme heat. Yet buried deep in the report is a figure showing that heat waves are no more frequent today than in 1900. This artifice also appeared in the government’s 2014 National Climate Assessment, which emphasized a post-1980 increase in hurricane power without discussing the longer term record. The National Oceanic and Atmospheric Administration recently stated that it has been unable to detect any human impact on hurricanes.
Such data misrepresentations violate basic scientific norms. In his celebrated 1974 “Cargo Cult” lecture, the late Richard Feynman admonished scientists to discuss objectively all the relevant evidence, even that which does not support the narrative. That’s the difference between science and advocacy.
These deficiencies in the new climate report are typical of many others that set the report’s tone. Consider the different perception that results from “sea level is rising no more rapidly than it did in 1940” instead of “sea level rise has accelerated in recent decades,” or from “heat waves are no more common now than they were in 1900” versus “heat waves have become more frequent since 1960.” Both statements in each pair are true, but each alone fails to tell the full story.
Several actions are warranted. First, the report should be amended to describe the history of sea-level rise, heat waves and other trends fully and accurately. Second, the government should convene a “Red/Blue” adversarial review to stress-test the entire report, as I urged in April. Critics argue such an exercise would be superfluous given the conventional review processes, and others have questioned even the minimal time and expense that would be involved. But the report’s deficiencies demonstrate why such a review is necessary.
Finally, the institutions involved in the report should figure out how and why such shortcomings survived multiple rounds of review.
Mr. Koonin was undersecretary of energy for science during President Obama’s first term and is director of the Center for Urban Science and Progress at New York University.
Steve Koonin has written an essay Critique of the Draft of the CCSR discussion of post 1900 sea level rise [link CSSR on SLR]
Read the whole thing, it is very concise and packs a well-documented punch.
Featured Video

Billionaires and Officials Are Just Blatantly Ignoring the Will of the People
or go to
Aletho News Archives – Video-Images
From the Archives
World War II Didn’t End The Great Depression
Stark Realities with Brian McGlinchey | April 4, 2024
A principal goal of Stark Realities is to “expose fundamental myths across the political spectrum” — and few myths are as universally embraced as the notion that US participation in World War II (1941-1945) lifted the American economy out of the Great Depression.
This myth is dangerous not only because it leads citizens and politicians to see a bright side of war that doesn’t really exist, but also because it helps foster a belief that government spending is essential to countering economic downturns. That belief, in turn, has helped propel us to a point where the national debt now exceeds $34.6 trillion, with interest payments alone on pace to reach $1 trillion a year in 2026, inviting financial catastrophe. … continue
Blog Roll
 Aletho News
- Iran warns UAE, Bahrain over alignment with US, Israeli interests
- ‘Little Sparta’: Why The UAE Attacked Iran for Israel’s Sake
- Iran Blames European Tanker for Oil Slick Near Kharg
- Hamas leaders say targeting families will fail to extract concessions
- Harrowing testimonies expose Israeli torture of Gaza hospital director
- UAE provides $100m for US-backed Gaza police force vetted by Shin Bet
- Britain quietly approves $11.85m arms licence to Israel despite Gaza ban
- Britain’s population replacement has passed the point of no return
- US-Iran ‘Calibrated Escalation’ Risks Sliding Into All-Out War – Expert
- Iran – End of the Drought & the Destruction of US Radar Installations in the Middle East
- If Americans Knew
- Group indicted for insider trading allegedly used ‘going to Israel’ as code for illegal sales
- Israel is enabling a possible plague in Gaza – Daily Update
- A Conservative’s View: Trump’s War on Iran Is Destroying America
- Israel’s war on the West Bank comes for Palestinian greenhouses
- New $270 million Israeli-only roads project in the West Bank is Netanyahu’s latest bid to impose de facto annexation
- Gaza investigation: A family’s fight to find their missing relatives
- MSF: Israel’s deliberate restriction of food and aid led to alarming malnutrition levels in Gaza
- Israel earmarks $270M for Israeli-only roads (that’s apartheid) – Daily Update
- Two Supreme Court Justices were secret agents who helped Israel cover up its attack on the USS Liberty
- Bari Weiss ‘Meddles’ With ‘CBS Sunday Morning’ Story on Palestine
- No Tricks Zone
- New Study: Declining Trends In 1980-2023 Tropical Cyclone Frequency, Accumulated Energy
- 46 IPCC Scientists Break Rank, Publicly Challenge Long-Standing Dogmatic Climate Claims
- Another Study Links Warming To Cloud Forcing, Shortwave Radiation, Natural Atmospheric Circulation
- Wind Energy Is Toxic, Hazardous To Human Health, Scientific Review Shows
- Oversupply Of Volatile Solar Energy Leads To Record NEGATIVE Prices!
- New Study: Extreme Heat Records, Heatwaves, Extreme Cold Records Declining Across US Since 1899
- It’s The Cold, Stupid! Cold 20 Times More Lethal Than Heat, Multiple Studies Show
- European Institute For Climate And Energy: “Climate Debate is Seldom About Science”
- New Study: The Climate May Be 5 Times More Sensitive To Solar Forcing Than Commonly Assumed
- EV Industry Reached $70 Billion In Losses In 2024 Due To Delusional Green Ideologies
