Ringed seal biologist Steven Ferguson, in a statement to a reporter from the Winnipeg Free Press, made one of the boldest predictions I’ve ever heard:
“Hudson Bay could experience its first free winter within 5-10 years.”
You heard it here, folks. It appears Ferguson thinks Hudson Bay was never ice-free in winter even during the Eemian Interglacial, when the Bering Sea was ice-free in winter – something that has not come close happening in recent years (Polyak et al. 2010:1769).
Sounds like a bit of ill-advised grandstanding to me.
The Winnipeg Free Pressreported Ferguson’s claim yesterday that ringed seal numbers in Hudson Bay declined by almost 80% the spring after the late freeze-up year of 2010, as part of a non-peer reviewed conference paper he gave (so no one can see the data he’s talking about).
However, polar bear surveys were done that summer and found no decline in numbers. The mark-recapture study (Lunn et al. 2016), you will recall, surveyed only about 1/2 of Western Hudson Bay territory so their estimate of about 800 bears was invalid for comparison to previous years. An aerial survey of the entire subpopulation the same year (Stapleton et al. 2014) found about 1030 bears – statistically, no change since the last estimate in 2004 (the IUCN PBSG uses 1030 as the official population size).
Southern Hudson Bay bears also showed no decline in numbers after 2010, as indicated by a survey undertaken in 2011 and 2012 (Obbard et al. 2015, 2016). The most recent Foxe Basin survey (Stapleton et al.2015) was done just before (summers of 2009 and 2010) the supposed decline of seals in the spring of 2011.
So, if Hudson Bay ringed seals suffered a “near-catastrophic” decline in numbers in the spring of 2011 after the late freeze-up in fall 2010, there must still have been plenty of seals left to feed the polar bears that depended on them for survival.
Apparently, ringed seal numbers rebounded after the spring decline of 2011 but Ferguson either failed to say to what levels or the reporter failed to mention it.
Well yes, I guess they did recover because how else could polar bears have come ashore this summer in such spectacularly good condition if seal numbers were still profoundly low?
For perspective, have a look at this previous post on Hudson Bay seals and the effect of variations in snow cover (for which Ferguson provided much of the data).
Quotes from the WFP article:
Ringed seal population in the Hudson Bay is declining.
A near-catastrophic plunge in the population of ringed seals in Hudson Bay is being blamed on melting sea ice caused by global warming, says a study led by a Manitoba researcher.
The population has been diminished by 75 per cent since aerial surveys started 20 years ago, according to data that will be presented to the ArcticNet conference of scientists in Winnipeg this week.
Lead researcher Steve Ferguson, a scientist with Fisheries and Oceans Canada and the University of Manitoba, said global warming is causing sea ice to disappear earlier in spring and form later in the fall, and there is less of it in Hudson Bay.
…
And in turn, the polar bear population will suffer because seals are the main component of their winter diet. The problem is compounded, as less sea ice means the bears have less area to hunt.
Hudson Bay could experience its first ice-free winter within five to 10 years, Ferguson said
“I don’t think polar bears and seals will be able to adapt. I think they’ll just die out in places like Hudson Bay. There’s little to stop the trend in loss of sea ice, even if we stop producing greenhouse gasses,” he said.
The study’s findings portend disaster for the Arctic generally.
“Hudson Bay is the early warning area of climate change because it is so far south,” Ferguson said. “We’re seeing the changes more dramatic in Hudson Bay, and it’s showing us how the rest of the Circumpolar Arctic will be impacted.”
Ferguson said while many people believe climate change is gradual, aerial surveys reveal mammals can disappear in huge numbers in a short period of time.
After a particularly warm 2010, the seal population plunged almost 80 per cent. Seal immune systems seemed to weaken, making them more susceptible to pathogens. Some of that loss has been recovered, he said.
Aerial surveys are not really “population surveys,” but are the most accurate available indicator, and they show a definite trend. They’re done each spring by counting seals on the ice.” [my bold]
References
Lunn, N.J., Servanty, S., Regehr, E.V., Converse, S.J., Richardson, E. and Stirling, I. 2016. Demography of an apex predator at the edge of its range – impacts of changing sea ice on polar bears in Hudson Bay. Ecological Applications, in press. DOI: 10.1890/15-1256
Obbard, M.E., Stapleton, S., Middel, K.R., Thibault, I., Brodeur, V. and Jutras, C. 2015. Estimating the abundance of the Southern Hudson Bay polar bear subpopulation with aerial surveys. Polar Biology 38:1713-1725.
Obbard, M.E., Cattet, M.R.I., Howe, E.J., Middel, K.R., Newton, E.J., Kolenosky, G.B., Abraham, K.F. and Greenwood, C.J. 2016. Trends in body condition in polar bears (Ursus maritimus) from the Southern Hudson Bay subpopulation in relation to changes in sea ice. Arctic Science, in press. 10.1139/AS-2015-0027
Polyak, L., Alley, R.B., Andrews, J.T., Brigham-Grette, J., Cronin, T.M., Darby, D.A., Dyke, A.S., Fitzpatrick, J.J., Funder, S., Holland, M., Jennings, A.E., Miller, G.H., O’Regan, M., Savelle, J., Serreze, M., St. John, K., White, J.W.C. and Wolff, E. 2010. History of sea ice in the Arctic. Quaternary Science Reviews29:1757-1778. http://bprc.osu.edu/geo/publications/polyak_etal_seaice_QSR_10.pdf
Stapleton S., Atkinson, S., Hedman, D., and Garshelis, D. 2014. Revisiting Western Hudson Bay: using aerial surveys to update polar bear abundance in a sentinel population. Biological Conservation170:38-47. http://www.sciencedirect.com/science/article/pii/S0006320713004618#
Stapleton, S., Peacock, E., and Garshelis, D. 2015. Aerial surveys suggest long-term stability in the seasonally ice-free Foxe Basin (Nunavut) polar bear population. Marine Mammal Science 32(1):181-201.
I am a climate lukewarmer. That means I think recent global warming is real, mostly man-made and will continue but I no longer think it is likely to be dangerous and I think its slow and erratic progress so far is what we should expect in the future.
This view . . . is even more infuriating to most publicly funded scientists and politicians, who insist climate change is a big risk.
I was even kept off the shortlist for a part-time, unpaid public-sector appointment in a field unrelated to climate because of having this view, or so the headhunter thought. In the climate debate, paying obeisance to climate scaremongering is about as mandatory for a public appointment, or public funding, as being a Protestant was in 18th-century England.
I was not always a lukewarmer. When I first started writing about the threat of global warming more than 26 years ago, as science editor of The Economist, I thought it was a genuinely dangerous threat.
Gradually, however, I changed my mind. What sealed my apostasy from climate alarm was the extraordinary history of the famous “hockey stick” graph, which purported to show that today’s temperatures were higher and changing faster than at any time in the past thousand years. I began to read the work of two Canadian researchers, Steve McIntyre and Ross McKitrick.
What shocked me more was the scientific establishment’s reaction to this: it tried to pretend that nothing was wrong. And then a flood of emails was leaked in 2009 showing some climate scientists apparently scheming to withhold data, prevent papers being published, get journal editors sacked and evade freedom-of-information requests, much as sceptics had been alleging. That was when I began to re-examine everything I had been told about climate change and, the more I looked, the flakier the prediction of rapid warming seemed.
The policies being proposed to combat climate change, far from being a modest insurance policy, are proving ineffective, expensive, harmful to poor people and actually bad for the environment: we are tearing down rainforests to grow biofuels and ripping up peat bogs to install windmills that still need fossil-fuel back-up. Some insurance policy.
To begin with, after I came out as a lukewarmer, I would get genuine critiques from scientists who disagreed with me and wanted to exchange views. They often resorted to meta-arguments, especially the argument from authority: if the Royal Society says it is alarmed, then you should be alarmed. If I want argument from authority, I replied, I will join the Catholic Church.
One by one, many of the most prominent people in the climate debate began to throw vitriolic playground abuse at me. I was “paranoid”, “specious”, “risible”, “self-defaming”, “daft”, “lying”, “irrational”, an “idiot”. Their letters to the editor or their blog responses asserted that I was “error-riddled” or had seriously misrepresented something, but then they not only failed to substantiate the charge but often roughly confirmed what I had written.
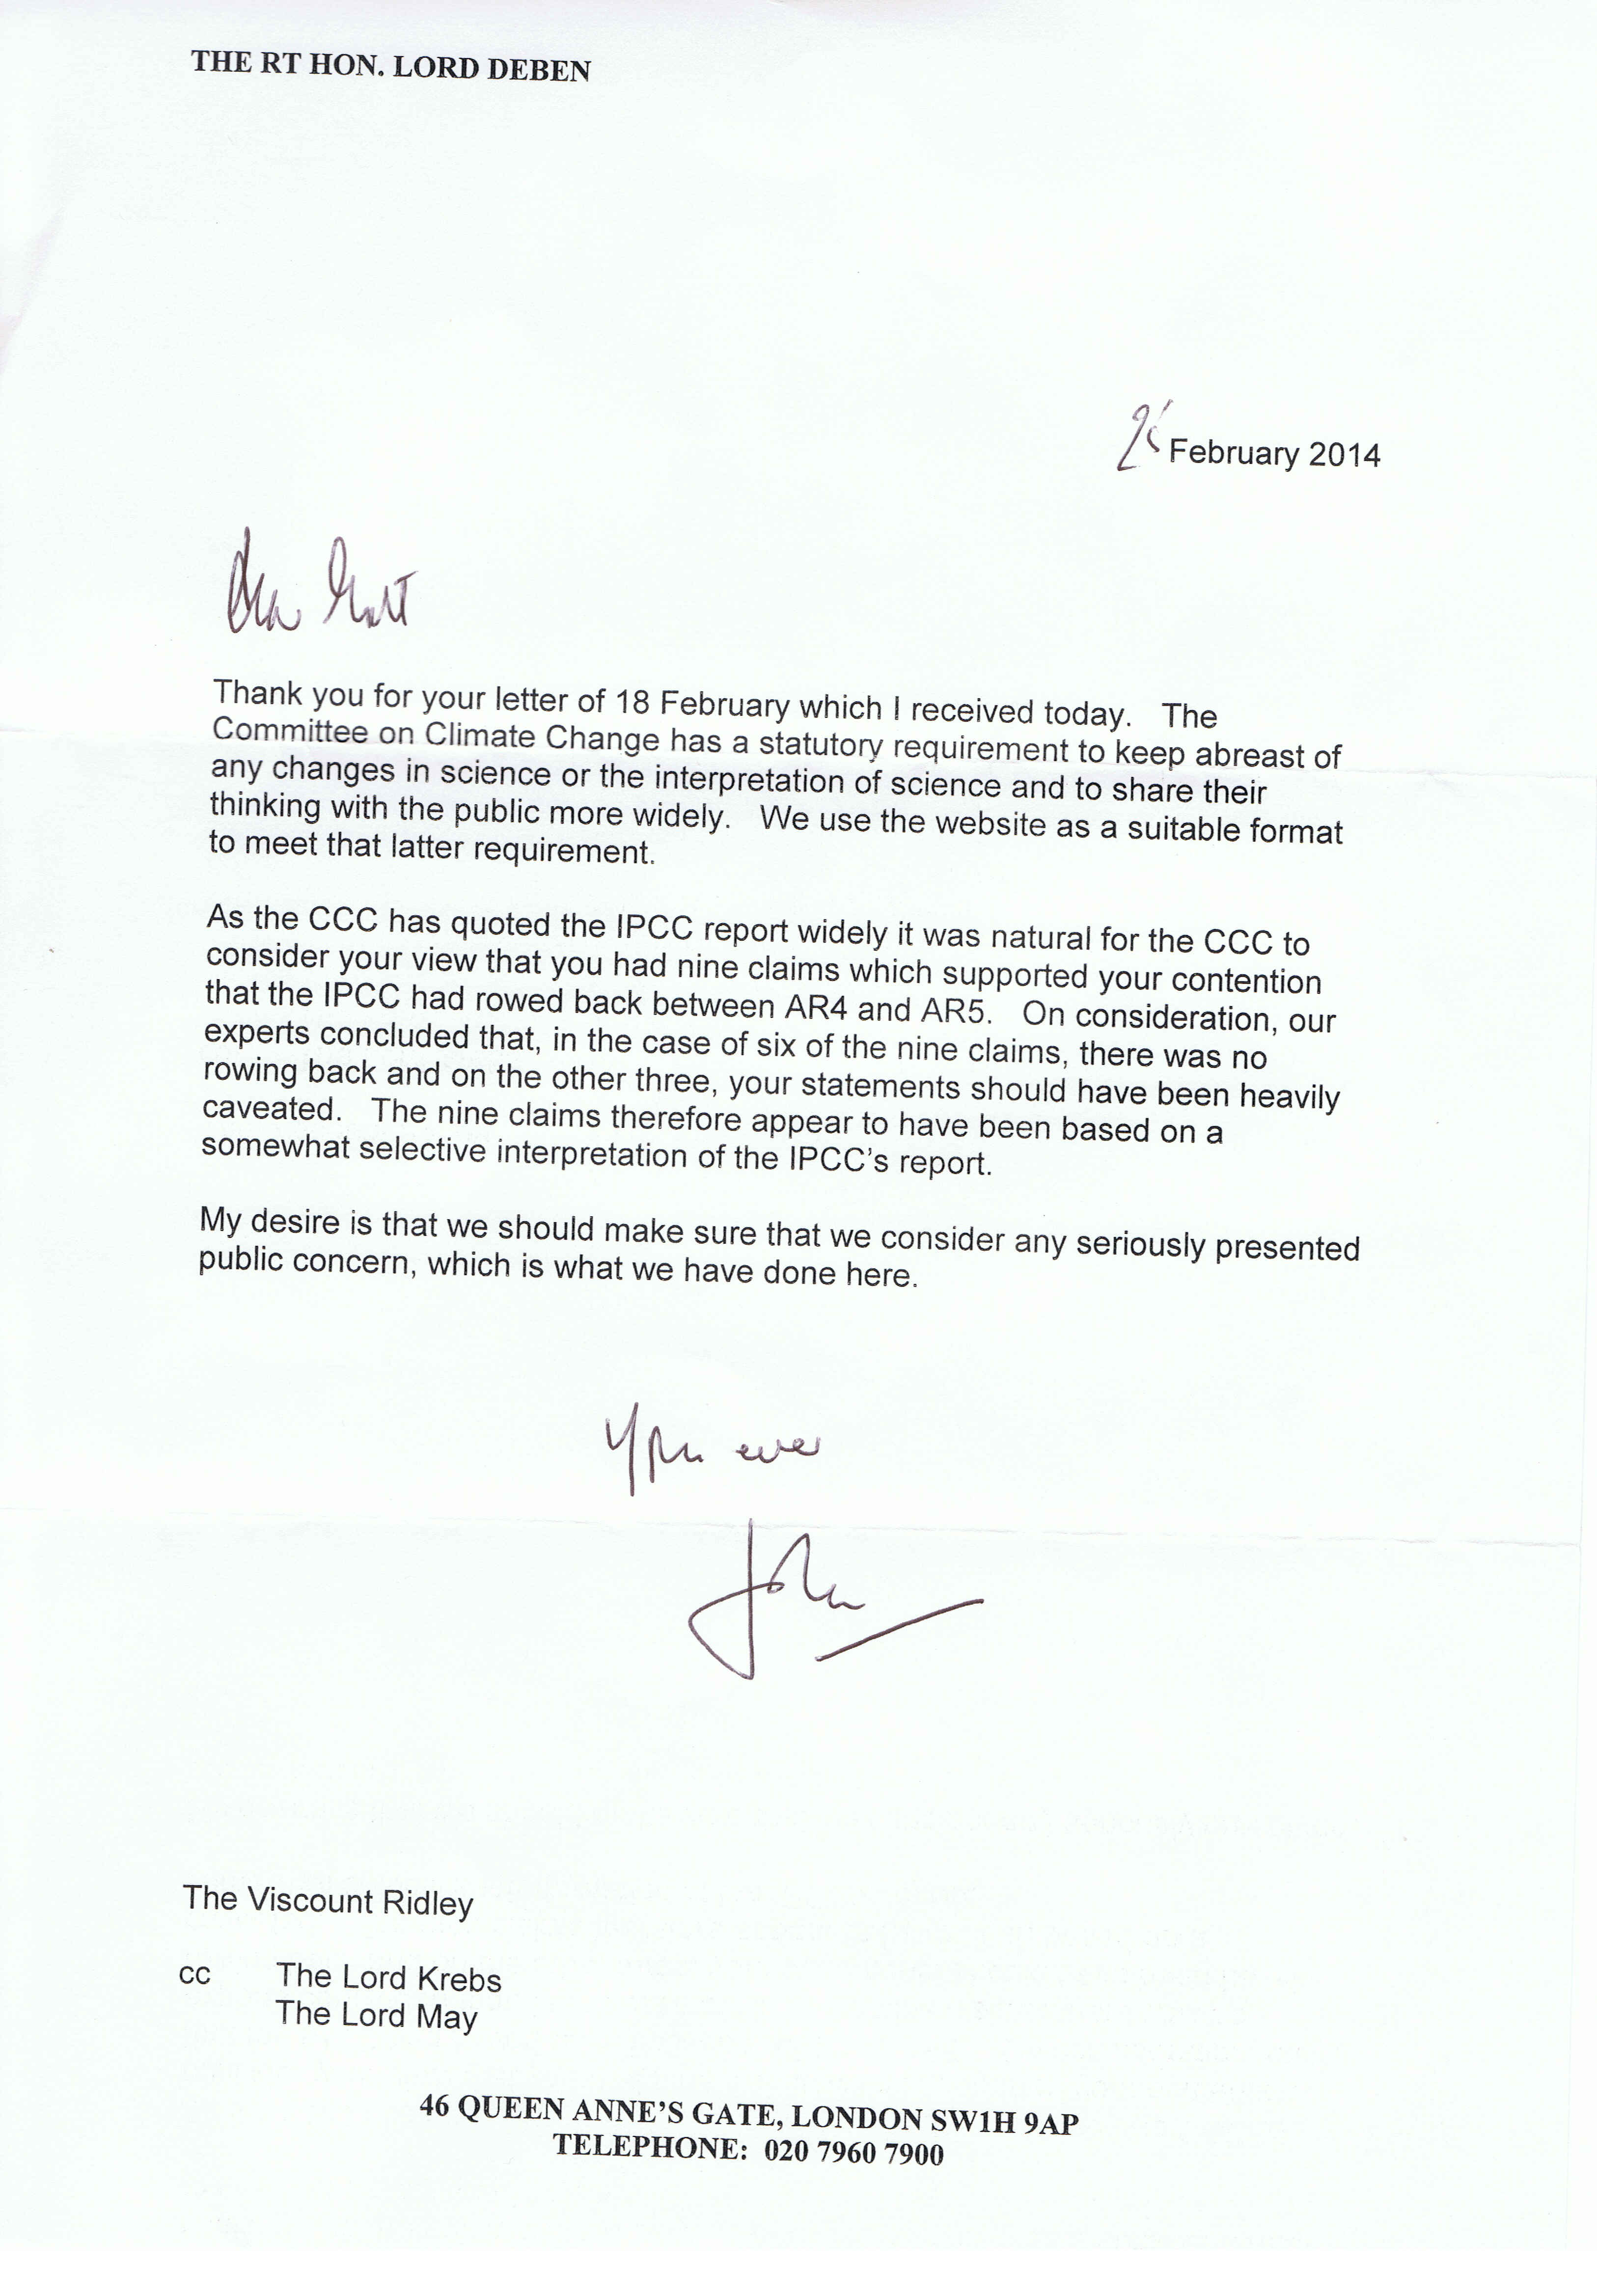
Talking of the committee on climate change, last year Lord Deben commissioned an entire report to criticise something I had said. Among other howlers, it included a quotation from the IPCC but the quote had a large chunk cut from the middle. When this cut was restored the line supported me, not Lord Deben. When I pointed this out politely to Lord Deben, he refused to restore the excision and left the document unchanged on the committee’s website.
I suppose all this fury means my arguments are hitting home.
I have never met a climate sceptic, let alone a lukewarmer, who wants his opponents silenced. I wish I could say the same of those who think climate change is an alarming prospect.
At the bottom of that rather flawed article from the Weather Channel is a series of photos of glaciers, all designed to suggest that they have been melting rapidly because of your SUV.
For instance, Alaska’s Muir Glacier:
For some reason, they forgot to mention what the USGS had to say about the Muir in 2001:
The glacier that filled Glacier Bay during the Little Ice Age began its retreat from the mouth of the bay more than 200 years ago and has exposed a magnificent fjord system about 100 km long. The massive glacier retreated past Sitakaday Narrows ~190 years ago, retreated past Whidbey Passage ~160 years ago, and reached the upper end of the main bay by 1860 (~140 years ago).
It seems to me that a majority of experts could be wrong whenever you have a pattern that looks like this:
1. A theory has been “adjusted” in the past to maintain the conclusion even though the data has changed. For example, “Global warming” evolved to “climate change” because the models didn’t show universal warming.
2. Prediction models are complicated. When things are complicated you have more room for error. Climate science models are complicated.
3. The models require human judgement to decide how variables should be treated. This allows humans to “tune” the output to a desired end. This is the case with climate science models.
4. There is a severe social or economic penalty for having the “wrong” opinion in the field. As I already said, I agree with the consensus of climate scientists because saying otherwise in public would be social and career suicide for me even as a cartoonist. Imagine how much worse the pressure would be if science was my career.
5. There are so many variables that can be measured – and so many that can be ignored – that you can produce any result you want by choosing what to measure and what to ignore. Our measurement sensors do not cover all locations on earth, from the upper atmosphere to the bottom of the ocean, so we have the option to use the measurements that fit our predictions while discounting the rest.
6. The argument from the other side looks disturbingly credible.
One of the things that always fascinated me about jury trials is that attorneys from both sides can sound so convincing even though the evidence points in only one direction. A defendant is either guilty or innocent, but good lawyers can make you see it either way. Climate science is similar. I’ve seen airtight arguments that say climate science is solid and true, and I’ve seen equally credible-looking arguments that say it is bunk. From my non-scientist perspective, I can’t tell the difference. Both sides look convincing to me.
I write the Climate Audit blog. I first began serious study of paleoclimate when I asked Michael Mann for the FTP location data of his data (for the Hockey Stick) and he said that he had “forgotten” the location, but that one of his associates would find it for me. The associate said that the data was not in any one location, but volunteered to find it for me. I was astonished that a result could have been so widely disseminated without any sort of formal audit – not realizing at the time that “peer review” for a journal was a limited form of due diligence.
Scot [sic] writes: “You probably are not a scientist, and that means you can’t independently evaluate any of the climate science claims.” I had mathematical knowledge and skill and decided that it would be an interesting task to actually try to verify Mann’s results. It turned out that he had made a grotesque error in his attempt to calculate principal components, had withheld adverse verification statistics and had weighted his reconstruction on stripbark tree rings that were inappropriate.
When I examined other attempts to estimate temperature in the past 1000 years, I encountered problems with every one of them, incurring, in the process, severe antagonism on the part of university academics.
However, after being involved in the controversy for many years, I think that far too little attention (none) is paid to a very fundamental difference between “skeptics” and warmists on their respective perceptions on whether human emissions of CO2 thus far have caused “serious negative damage” to the world or not. Skeptics universally think not. Many do not dispute the idea that we are carrying on an “uncontrolled experiment”, but have nonetheless concluded that, through good luck rather than good management, the consequences have been inconsequential or even beneficial. On the other hand, warmists are thoroughly convinced we have already incurred “serious negative damage” though what they view as “serious negative damage” may well be viewed by a skeptic as relatively trivial, or, at worst, an ordinary cost and outweighed by other benefits. When I challenge warmists to enumerate the most serious of the damages experienced so far, I do not get answers.
Of the potential damages, sea level rise seems one of the most serious to me, but even there, some, if not much, of the potential problem arises from very long-term (Holocene scale) events that are not materially impacted by CO2 emissions.
While I have made numerous technical criticisms of work by climate scientists, I have mostly avoided commenting on policy, other than urging far better data archiving practices – a policy which many of my adversaries opposed. Needless to say, this has not prevented demonization from climate activists – a practice that obviously does not enable them to “persuade” their opponents and critics. Quite the opposite. In my experience, more “skeptics” are born from poor conduct by climate scientists than from the eloquence of earlier skeptics.
“[Climate change is] a very complex subject. I’m not sure anybody is ever going to really know…. they say they have science on one side but then they also have those horrible emails that were sent between the [Climategate] scientists…. Terrible. Where they got caught, you know, so you see that and you say, what’s this all about. I absolutely have an open mind.”
It has been seven years this month since the intellectual scandal erupted called Climategate. With President-elect Trump’s recent reference to the scandal, it is timely to recall some of the more salient quotations. Two books of particular interest in this recollection are A. W. Montford’s Hiding the Decline and Steve Gorham’s The Mad, Mad, Mad World of Climatism. (Also see the research site here.)
Climate scientist Judith Curry reassessed her thinking about the state of climate science in response to the grotesque context of the emails. And the scandal got worse after the fact when, according to Paul Stephens, “virtually the entire climate science community tried to pretend that nothing was wrong.”
Background:
On November 19, 2009, an internal whistle-blower or hacker downloaded more than 1,000 documents and e-mails from the Climatic Research Unit (CRU) at East Anglia University (United Kingdom). Posted on a Russian server, these documents were soon accessed by websites around the world.
These e-mails were a subset of confidential communications between top climate scientists in the UK, the United States, and other nations over a 15-year period.
Those involved developed surface temperature data sets, promoted the “Hockey Stick” global temperature curve, and wrote or edited the core of the Intergovernmental Panel on Climate Change (IPCC) assessment reports.
The email release, branded “Climategate” by British columnist James Delingpole, provide insight into practices that range from bad professionalism to fraudulent science. Bias, data manipulation, dodging freedom of information requests, and efforts to subvert the peer-review process were uncovered.
Some of the more salient quotations follow (followed by an appendix on the importance of Climategate for the so-called ‘skeptic’ movement).
Man-Made Warming Controversy
“I know there is pressure to present a nice tidy story as regards ‘apparent unprecedented warming in a thousand years or more in the proxy data’ but in reality the situation is not quite so simple.”
—Dr. Keith Briffa, Climatic Research Unit, disclosed Climategate e-mail, Sep. 22, 1999.
“Keith’s [Briffa] series…differs in large part in exactly the opposite direction that Phil’s [Jones] does from ours. This is the problem we all picked up on (everyone in the room at IPCC was in agreement that this was a problem and a potential distraction/detraction from the reasonably consensus viewpoint we’d like to show w/ the Jones et al and Mann et al series).”
—Dr. Michael Mann, IPCC Lead Author, disclosed Climategate e-mail, Sep. 22, 1999.
“… it would be nice to try to ‘contain’ the putative ‘MWP’ [Medieval Warm Period]…”
—Dr. Michael Mann, IPCC Lead Author, disclosed Climategate e-mail, June 4, 2003
“By the way, when is Tom C [Crowley] going to formally publish his roughly 1500 year reconstruction??? It would help the cause to be able to refer to that reconstruction as confirming Mann and Jones, etc.”
—Dr. Michael Mann, IPCC Lead Author, disclosed Climategate e-mail, Aug. 3, 2004.
“I gave up on Judith Curry a while ago. I don’t know what she thinks she’s doing, but it’s not helping the cause, or her professional credibility.”
—Dr. Michael Mann, IPCC Lead Author, disclosed Climategate e-mail, May 30, 2008
“Well, I have my own article on where the heck is global warming… The fact is that we can’t account for the lack of warming at the moment and it is a travesty that we can’t.”
—Dr. Kevin Trenberth, IPCC Lead Author, disclosed Climategate e-mail, Oct. 12, 2009.
Manipulating Temperature Data
“I’ve just completed Mike’s [Mann] Nature trick of adding in the real temps to each series for the last 20 years (i.e. from 1981 onwards) and from 1961 for Keith’s [Briffa] to hide the decline.”
—Dr. Phil Jones, Director of the Climatic Research Unit, disclosed Climategate e-mail, Nov. 16, 1999.
“Also we have applied a completely artificial adjustment to the data after 1960, so they look closer to observed temperatures than the tree-ring data actually were….”
—Dr. Tim Osborn, Climatic Research Unit, disclosed Climategate e-mail, Dec. 20, 2006.
“If you look at the attached plot you will see that the land also shows the 1940s warming blip (as I’m sure you know). So, if we could reduce the ocean blip by, say 0.15 deg C, then this would be significant for the global mean—but we’d still have to explain the land blip….”
—Dr. Tom Wigley, University Corporation for Atmospheric Research, on adjusting global temperature data, disclosed Climategate e-mail to Phil Jones, Sep. 28, 2008.
“We, therefore, do not hold the original raw data but only the value-added (i.e. quality controlled and homogenized) data.”
—Climatic Research Unit web site, the world’s leading provider of global temperature data, admitting that it can’t produce the original thermometer data, 2011.
Data Suppression; Freedom of Information (FOI) Avoidance
“We have 25 or so years invested in the work. Why should I make the data available to you, when your aim is to try to find something wrong with it.”
—Dr. Phil Jones, Director of the Climate Research Unit at East Anglia University, email to Warwick Hughes, 2004.
“I’m getting hassled by a couple of people to release the CRU station temperature data. Don’t any of you three tell anybody that the UK has a Freedom of Information Act.”
—Dr. Phil Jones, Director of the Climatic Research Unit, disclosed Climategate e-mail, Feb. 21, 2005.
“Mike [Mann], can you delete any e-mails you may have had with Keith [Trenberth] re AR4? Keith will do likewise…. Can you also e-mail Gene and get him to do the same? I don’t have his e-mail address…. We will be getting Caspar to do likewise.”
—Dr. Phil Jones, Director of the Climatic Research Unit, disclosed Climategate e-mail, May 29, 2008.
“You might want to check with the IPCC Bureau. I’ve been told that IPCC is above national FOI Acts. One way to cover yourself and all those working in AR5 [the upcoming IPCC Fifth Assessment Report] would be to delete all e-mails at the end of the process. Hard to do, as not everybody will remember it.”
—Dr. Phil Jones, Director of the Climatic Research Unit, on avoiding Freedom of Information requirements, disclosed Climategate e-mail, May 12, 2009.
Subverting the Peer-Review Process
“I can’t see either of these papers being in the next IPCC report. Kevin [Trenberth] and I will keep them out somehow, even if we have to redefine what the peer-review literature is!”
—Phil Jones, Director of the Climatic Research Unit, disclosed Climategate e-mail, July 8, 2004.
Appendix: Implications
“Climategate was a turning point,” Professor Judith Curry remembered, where “pronouncements from the IPCC were no longer sufficient.” She continued:
Institutionally, Climategate triggered the formation of the Global Warming Policy Foundation (GWPF), which has become quite influential in UK climate policy and to some extent internationally.
And more:
The skeptical climate blogosphere has thrived and expanded, largely triggered by Climategate (Climate Etc. was triggered largely by Climategate). Whereas the ‘warm’ blogosphere for the most part has waned (notably RealClimate ), with the exception of Skeptical Science. It seems that most of the ‘action’ on the warm side has switched to twitter, whereas skeptics prefer the blogosphere.
The growth of the technical skeptical blogosphere (pioneered by Steve McIntyre) has challenged traditional notions of expertise, i.e. credentials and sanctity of journal publications, through Climate Audit’s blogospheric deconstruction of many publications, particularly related to paleo proxies. While the technical skeptical blogosphere seems to have provided the motive for the Climategate ‘hack’, the technical skeptical blogosphere has thrived, and many of these sites are followed by the media and decision makers of various stripes.
The latest attempt to prove that tornadoes are becoming more extreme:
ABSTRACT
Tornadoes and severe thunderstorms kill people and damage property every year. Estimated U.S. insured losses due to severe thunderstorms in the first half of 2016 were 8.5 billion USD. The largest U.S. impacts of tornadoes result from tornado outbreaks, which are sequences of tornadoes that occur in close succession. Here, using extreme value analysis, we find that the frequency of U.S. outbreaks with many tornadoes is increasing and is increasing faster for more extreme outbreaks. We model this behavior by extreme value distributions with parameters that are linear functions of time or of some indicators of multidecadal climatic variability. Extreme meteorological environments associated with severe thunderstorms show consistent upward trends, but the trends do not resemble those currently expected to result from global warming.
This paper looks at the reported frequencies of tornadoes and their characteristics over the contiguous United States since 1970. There was a significant increase in tornado occurrence during two periods in the last 33 years – in the early 1980s when National Weather Service (NWS) warning verification began, and in 1990 when the WSR-88D [Dopppler] became operational…..
The years 1950-1969 were a growth period because it was the start of the public awareness and communication revolution that gave tornadoes increased publicity due to television news coverage and graphic depictions of tornadoes and tornado damage….
The increase in reported tornado frequency during the early 1990s corresponds to the operational implementation of Doppler weather radars. Other non-meteorological factors that must be considered when looking at the increase in reported tornado frequency over the past 33 years are the advent of cellular telephones; the development of spotter networks by NWS offices, local emergency management officials, and local media; and population shifts…..
The growing “hobby” of tornado chasing has also contributed to the increasing number of reported tornadoes. The capability to easily photograph tornadoes with digital photography, camcorders, and even cell phone cameras not only provides documentation of many weak tornadoes, but also, on occasion, shows the presence of multiple tornadoes immediately adjacent to each other.
This Tippett paper defines a tornado outbreak as one containing at least six tornadoes. But given that more tornadoes are now reported than in earlier decades, it is inevitable that more such outbreaks are now being recorded, and that they will tend to have a higher number on average.
Indeed, McCarthy’s comment “shows the presence of multiple tornadoes immediately adjacent to each other”, is particularly relevant. Prior to the use of mobile phones and Doppler, many of these would have simply been lumped together as just one big tornado.
This paper seems to be a classic case of a team of scientists, who appear to have little knowledge of the subject, using computer models to arrive at a preordained conclusion.
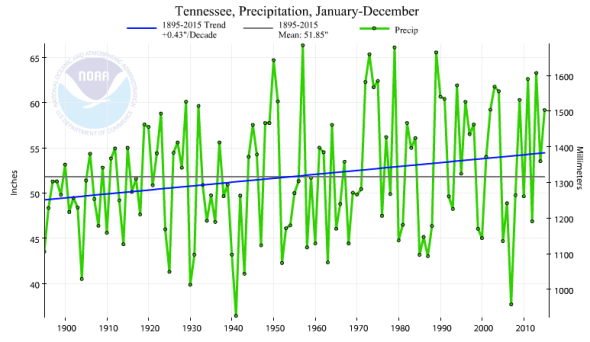
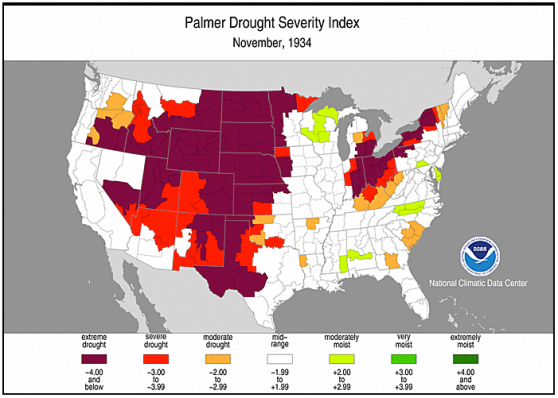
With 13 known fatalities and nearly a thousand buildings and structures destroyed in the tragic Tennessee fires, the usual climate ambulance chasers are out in force blaming, you guessed it, man-made “climate change”!
Author John Abraham notes “The causes of drought are combinations of lowered precipitation and higher temperatures.”
This is a no-brainer, however it is grossly dishonest to blame so-called, man-made climate change as the root cause of the fires based on “many weeks of weather (warm and dry) that have led to the current conditions.”
Climate change is measured over multi-decadal periods, usually over a 30 year period or ‘climate point’, not over “many weeks” as the Guardian ferments.
Abraham deliberately focuses on the “many weeks” time-scale because a longer look at Tennessee’s climate history wrecks his CO2-induced, man-made climate change theory…
Temperature
Tennessee temperature record shows no global warming climate change trend…
Finally, and the most glaring example of the hysterical Guardian’s dishonesty to its readership, is the simple fact that as CO2 has been increasing, the “Numbers of [Tennessee] wildfires have been trending downward since the late 1970’s.” !
This is why “fake news” organisations like The Guardian, CNN, ABC, The Age, The Sydney Morning Herald, NYTimes, Washington Post, BBC et al., cannot be trusted on anything related to global warming climate change.
They are not interested in “the science” that they and fellow climate alarmists claim to own, rather, their primary interest lies in misinforming readers and viewers with cherry-picked propaganda to further their political goals and ideological agenda.
And to dear John Abraham, “belief” and “denial” are the words of zealots, not scientists.
Those who continue to slime with the “denier” meme, in a vile reference to “Holocaust denial” (designed to intimidate and isolate) indicate they’ve run out of arguments, and slurs are all they have left. The historical climate data above, that took 10 minutes to source, exposes this.
•••
Climatism extends its condolences to the victims and their families and all those effected by the Tennessee wildfires.
The trappings of science can be decoupled from the actual rigor of science.
The trigger for this post is a recent article in the Atlantic, entitled How Will Trump Use Science to Further His Political Agenda? The article provides some important insights, that are worth discussing in context of the climate debate and the politicization of climate science. Excerpts:
Of all the memorable lines from this year’s election, the one I keep returning to months later is from Hillary Clinton’s acceptance speech at the Democratic National Convention. “And I believe in science,” she said, as she pivoted to climate change. She giggled. The crowd roared. Isn’t it absurd she had to say she believed in science? And most smug of all: Hillary, science is not a belief.
Clinton’s appeal to science as a partisan rallying cry . . . was clearly in response to the mockery of Trump and his supporters as “anti-science.” But “anti-science” is a dangerously simplistic label.
The trappings of science can be decoupled from the actual rigor of science. Stephen Colbert, who famously coined “truthiness,” less famously also came up with “factiness.” If “truthiness” is a feeling of truth with a disregard for the facts, then “factiness” is using actual facts to paint a misleading truth.
Factiness is the taste for the feel and aesthetic of “facts,” often at the expense of missing the truth. From silly self-help-y TED talks to wrapping ourselves in the misleading scientism of Fivethirtyeight statistics, factiness is obsessing over and covering ourselves in fact after fact while still missing bigger truths.
I’ll suggest that factiness doesn’t actually cleave neatly across the left and the right. It’s an outgrowth of our cognitive biases. We often make decisions emotionally, sometimes based on tribal affiliations; then we marshall the facts that prove us right while discarding the ones that prove us wrong. As such, throwing more facts at climate deniers hasn’t convinced them.
Factiness is why using the veneer of science to rationalize an idea is dangerous, making the idea appear more justified than it really is. It is pro-science in appearance, but anti-science in spirit.
In theory, science provides an objective framework for finding truths about the world. But in practice, science is conducted by humans with biases, often blind to them. To ignore how the practice of science is intertwined with politics is to be blind, in turn, to the coming changes. As a President Trump pulls the discourse in his direction, the ground will shift slowly but surely shift underneath our feet. It’s harder to recognize in the very beginning, when the ground has only shifted ever so slightly.
[read the Atlantic article for a fascinating and disturbing example of how science was used to support the Bush administration’s torture program in the early 2000s.]
JC reflections
I’ve previously used the concept of ‘truthiness’ in discussing why climate modelers believe their climate models [link]. But before delving into truthiness and factiness in the climate debate, a digression is needed to provide a context for understand what science is, and what a ‘fact’ is.
I’ve written many previous posts on Scientific method and Sociology of science. Why so many posts on these topics? Because these are exceedingly complex issues, especially in context of the huge scientific complexity of global climate change.
As per the Wikipedia (which has good summary on this topic):
A fact is something that has really occurred or is actually true. The usual test for a statement of fact is verifiability—that is, whether it can be demonstrated to correspond to experience.
Fact is sometimes used synonymously with truth, as distinct from opinions, falsehoods, or matters of taste. Fact may also indicate findings derived through a process of evaluation, including review of testimony, direct observation, or otherwise; as distinguishable from matters of inference or speculation. Facts may be checked by reason, experiment, personal experience, or may be argued from authority.
In science, a fact is a repeatable careful observation or measurement (by experimentation or other means), also called empirical evidence. Facts are central to building scientific theories. Various forms of observation and measurement lead to fundamental questions about the scientific method, and the scope and validity of scientific reasoning.
In the most basic sense, a scientific fact is an objective and verifiable observation, in contrast with a hypothesis or theory, which is intended to explain or interpret facts.
Scholars and clinical researchers in both the social and natural sciences have written about numerous questions and theories that arise in the attempt to clarify the fundamental nature of scientific fact. Pertinent issues raised by this inquiry include: the process by which “established fact” becomes recognized and accepted as such; whether and to what extent “fact” and “theoretic explanation” can be considered truly independent and separable from one another; to what extent “facts” are influenced by the mere act of observation; and to what extent factual conclusions are influenced by history and consensus, rather than a strictly systematic methodology.
What are the facts in the climate science debate?
Average global surface temperatures have overall increased for the past 100+ years
Carbon dioxide has an infrared emission spectra
Humans have been adding carbon dioxide to the atmosphere.
That is pretty much it, in terms of verifiable, generally agreed upon scientific facts surrounding the major elements of climate change debate.
Human caused global warming is a theory. The assertion that human caused global warming is dangerous is an hypothesis. The assertion that nearly all or most of the warming since 1950 has been caused by humans is disputed by many scientists, in spite of the highly confident consensus statement by the IPCC. The issue of ‘dangerous’ climate change is wrapped up in values, and science has next to nothing to say about this.
Truthiness and factiness abounds in the climate science debate, and the greatest proponents of truthiness and factiness are the climate ‘alarmed’ – their opponents are mostly calling b.s. on their truthiness and factiness. In slinging around terms like denier, anti-science etc, the defense of climate alarmism in terms of ‘science’ and ‘facts’ starts to become more anti-science than what they are accusing their opponents of.
The term “antiscience” refers to persons or organizations that promote their ideology over scientifically-verified evidence, usually either by denying said evidence and/or creating their own. Antiscience positions are promoted especially when political ideology and/or religious dogma conflict with actual science.
The most glaring ‘factiness’ and anti-science strategy is the linking of extreme weather events to human caused climate change. Roger Pielke Jr has an eloquent op-ed in the WSJ (unfortunately behind paywall, which I will have more to say about in another post next week).
So . . . who fits the definition of ‘anti-science’? Hillary Clinton or Donald Trump? Ignoring science (Trump) does not qualify him for ‘anti-science’. Science does not prescribe public policy. The political dogma of Obama, Clinton and Pope Francis surrounding climate change seems like more of a recipe for ‘anti-science.’
Researchers found that ice conditions in the 19th century were remarkably similar to today’s, observations falling within normal variability. The study is Accounts from 19th-century Canadian Arctic Explorers’ Logs Reflect Present Climate Conditions (here) by James E. Overland, Pacific Marine Environmental Laboratory/NOAA, Seattle,Wash., and Kevin Wood, Arctic Research Office/NOAA, Silver Spring, Md. H/t GWPF
Overview
This article demonstrates the use of historical instrument and descriptive records to assess the hypothesis that environmental conditions observed by 19th-century explorers in the Canadian archipelago were consistent with a Little Ice Age as evident in proxy records. We find little evidence for extreme cold conditions.
It is clear that the first-hand observations of 19th-century explorers are not consistent with the hypothesized severe conditions of a multi-decadal Little Ice Age. Explorers encountered both warm and cool seasons, and generally typical ice conditions, in comparison to 20th-century norms.
Analysis
There were more than seventy expeditions or scientific enterprises of various types dispatched to the Canadian Arctic in the period between 1818 and 1910. From this number, we analyzed 44 original scientific reports and related narratives; many from expeditions spanning several years. The majority of the data come from large naval expeditions that wintered over in the Arctic and had the capacity to support an intensive scientific effort. A table listing the expeditions and data types is located at http://www.pmel.noaa.gov/arctic/history. The data cover about one-third of the possible number of years depending on data type, and every decade is represented.
Our analysis focuses on four indicators of climatic change: summer sea ice extent, annual sea ice thickness, monthly mean temperature, and the onset of melt and freeze as estimated from daily mean temperature. Historical observations in these four categories were compared with modern reference data; the reference period varied, depending on data availability. Both sea ice extent and the onset of melt and freeze were compared to the 30- year reference period 1971–2000; monthly means are compared to the 50-year period 1951–2000. Modern sea ice thickness records are less continuous, and some terminate in the 1980s; the reference period is therefore based on 19 to 26 years of homogeneous record.
Fig.1.
(a) Proxy record of standardized summer air temperature variation derived from ice cores taken on Devon Island. This proxy record suggests that a significantly colder climate prevailed in the 19th century. Shading indicates temperatures one standard deviation warmer or colder than average for the reference period 1901–1960 [Overpeck,1998].
(b) Historical monthly mean temperature observations compared to the 20th-century reference period 1951–2000. Sixty-three percent of 343 monthly mean temperatures recorded on 19th-century expeditions between 1819 and 1854 fall within one standard deviation of the reference mean at nearby stations (reference data from Meteorological Service of Canada,2002; and National Climatic Data Center,2002).
(c) Onset of melt observed by expeditions between 1820 and 1906 expressed as departures from the mean for the reference period 1971–2000. The period of melt transition observed by 19th century explorers is not inconsistent with modern values.
(d) Onset of freeze observed between 1819 and 1905 compared to the reference period 1971–2000. The onset of freeze transition is frequently consistent with modern values,but in some cases occurred earlier than usual. The incidence of an early onset of freeze represents the largest departure from present conditions evident in the historical records examined in this study. Melt and freeze transition dates for the reference period 1971–2000 were calculated from temperature data extracted from the Global Daily Climatology Network data base (National Climate Data Center, 2002).
Fig.2. The ship tracks and winter-over locations of Arctic discovery expeditions from 1818 to 1859 are surprisingly consistent with present sea ice climatology (contours represented by shades of blue). The climatology shown reflects percent frequency of sea ice presence on 10 September which is the usual date of annual ice minimum for the reference period 1971–2000 (Canadian Ice Service,2002). On a number of occasions, expeditions came within 150 km of completing the Northwest Passage, but even in years with unfavorable ice conditions, most ships were still able to reach comparatively advanced positions within the Canadian archipelago. By 1859, all possible routes comprising the Northwest Passage had been discovered.
Summary
As stated here before, Arctic ice is part of a self-oscillating system with extents expanding and retreating according to processes internal to the ocean-ice-atmosphere components. We don’t know exactly why 19th century ice extent was less than previously or less than the 1970s, but we can be sure it wasn’t due to fossil fuel emissions.
Explorers encountered both favorable and unfavorable ice conditions. This drawing from the vicinity of Beechey Island illustrates the situation of the H.M.S.Resolute and the steam-tender Pioneer on 5 September 1850 [from Facsimile of the Illustrated Arctic News, courtesy of Elmer E. Rasmuson Library, Univ. of Alaska Fairbanks].
No, weather is NOT climate… even when it’s warm outside. But in case there’s a climate cultist in your life that insists otherwise, here are some facts about global warming and vaguely-defined “extreme” weather that you can use to talk some sense into them.
Until the noise of a century of media hype and unscientific speculation about the Arctic has been removed from the public debate, science will be unable to explain what, if anything, the signal from the Arctic is telling us.
In the last days of the Northern hemisphere’s summer, the sea ice that covers part of the Arctic Ocean reaches its minimum extent.
The annual change, recorded by satellites, has come to be seen as evidence of anthropogenic global warming, and a warning of what is to come.
It features in the global news every Summer. One journalist has called it the planet’s ‘white flag of surrender’, others the ‘Arctic Death Spiral’.
The lowest sea ice extent ever recorded was in 2012, and previous to that in 2007.
In the 2000s, a new trend of decreasing sea ice minimums seemed to be emerging. Whereas computer models had predicted that Arctic summer sea ice wouldn’t disappear until the middle of the century, the rate of decline seemed to be much faster.
The story of rapid, unnatural change and the plight of the polar bear became powerful symbols of climate change happening in real time. Campaigners launched high profile, swimming, kayaking and evidence-gathering missions to the North Pole to draw the media’s attention to the issue.
In 2007, media stories featured the claims of Prof. Wieslaw Maslowski, who claimed that the ice would be gone by 2013.
The following year, Mark Serreze, of the US National Snow and Ice Data Center (NSIDC) predicted that 2008 could be “become ice free at the North Pole this year.”
And in 2009, Al Gore announced ‘there is a 75 per cent chance that the entire north polar ice cap, during the summer months, could be completely ice-free within the next five to seven years.’
But the missions to the Arctic were hampered by bad weather, not open sea. And the dates by which climate scientists and politicians said the ice would disappear have come and gone, while the ice has remained.
Undaunted, fresh predictions have been made in every subsequent year.
2016 was no exception. In June, one scientist claimed that his prediction of an ice-free Arctic ocean might finally come true. The story made headlines throughout the world. But rather than disappearing, the joint-second lowest sea ice extent since 1978 was recorded.
This has caused controversy within climate science. A decade of failed predictions has signalled that science does not yet understand what drives variation in the Arctic. Some scientists have urged more caution. But the story of the Arctic’s ‘death spiral’ featured in news reports, in spite of these warnings.
And the story has a very long history.
In the 1950s, newspapers report the findings of an international panel of scientists. They predicted that the Arctic could be ice-free by the end of the 1970s.
Even as far back as the early 1920s, newspapers carried stories of a ‘great thaw’. One journalist wrote that ‘the giant ice cap has retreated as though in a flash’, adding that ‘the man of science breathes in our ear that outside of what has been described in Genesis there has been nothing like it in all history’.
By the 1970s concerns returned to the possibility of a new ice age, that would see the Arctic sea ice grow, making the Northern hemisphere inhospitable to agriculture.
One problem that persists is that there is still only a relatively short series of direct measurements on which to base our understanding of the Arctic.
Satellite monitoring of the Arctic only began in 1978, giving us less than forty years of reliable data. This may not be enough to establish what is normal – or abnormal – for the region.
The beginning of the satellite data starts at the end of a 40-year cooling phase, which may mean that our record of Arctic sea ice begins from an unusually high point.
Recent analysis of sea ice area shows that, although the last decade may have seen the most dramatic minimum extents, the decade that shows the greatest rate of decline occurred between 1998 and 2008 and that data since then shows significantly less decline.
And other explanations may better account for these observed changes than global warming.
One explanation for the more stable sea ice conditions seen since 2007 might be the Atlantic Multi-decadal Oscillation, or AMO – a natural cycle of warming and cooling. AMO peaked in 2008, and has recently entered a negative phase. The decline of summer sea ice may at least in part be a response to this and other natural cycles.
Rather than being based on an understanding of the Arctic’s climate, estimates of rapid sea ice decline have been made by simply drawing a straight line through the data. This may not be a safe way of making predictions, or of attributing sea ice decline to anthropogenic global warming.
As soon as the 2016 Arctic sea ice minimum was reached, it began its recovery, as it does every year. Even if we were to see an ice free summer Arctic, the significance of this event might be only symbolic.
Until the noise of a century of media hype and unscientific speculation about the Arctic has been removed from the public debate, science will be unable to explain what, if anything, the signal from the Arctic is telling us.
We all know that people differ mentally in a great many ways: some are reflective, others impulsive; some are sympathetic, others are sociopathic; some are creative, others seem never to have a witty or imaginative thought; some are sensible, others are flighty, fanatical, or prone to panic; and some are smart, whereas others cannot do a simple arithmetical calculation in their head or solve an elementary logical puzzle.
So how do we measure the human intellect? Among educators and psychologists, the most common procedure is to conduct a test of reasoning ability that yields a result called an intelligence quotient, or IQ.
Some people think IQ’s are terrifically important and that people can be ranked from dumb to brilliant according to their IQ. Moreover, it is widely believed that one’s IQ is largely genetically determined at birth.
Thus to many, IQ is a mark of inherent social rank.
A problem with this idea is that IQ’s seem to vary according to experience and culture. Sub-Saharan Africans, for example, are widely said to have IQ’s averaging 20 to 30 points lower than the average of about 100, which is typical of most European populations. Trouble is, when Africans migrate to Europe, their IQ’s rise. Same with country folk versus city folk. The former seem to have lower IQ’s until they migrate to the city, then they, or their children, match the IQ’s of the city-born.
There’s also the effect known as test sophistication, which means that the more IQ tests you take the better you get at them. So IQ is not quite so firmly fixed by the genes as many people seem to believe. Moreover, there are generational differences in IQ, with IQ’s of most populations rising by five to as much as 30 points per generation since the beginning of the 20th Century, this phenomenon being known as the Flynn Effect.
But if people differ in intellect in ways other than reasoning capacity, what value is there in judging intellect by IQ?
For example, does IQ measure creativity, judgement, diligence, responsibility, or empathy?
Obviously not. Moreover, very little is knows about the effect of environment, diet, or culture on the many facets of human intelligence.
So why is so much attention given to the measurement of IQ?
Such a narrow view of human mentality seems not very intelligent, really.
Almost anyone with adequate schooling can learn to observe carefully, perform basic logical processes, make comparisons, draw more or less obvious logical inferences, and perform all the other operations that underlie appropriate responses to IQ test questions.
But not everyone is creative, sound in judgement, socially responsible, mentally vigorous, or possessed of the power of empathy.
And without those other qualities of mind, how useful is an abnormally high IQ?
In most circumstances, not very.
In fact, the idea of rating intellect on a single linear scale seems neither sensible nor useful, whereas it is almost certainly seriously misleading and, therefore, harmful.
… At every corner, we are urged to simply believe what we are told. Whether it is about believing Porton Down and MI6 about “novichok”, or believing the White Helmets about Sarin, or believing the FBI about “collusion”, we are presented with no facts, just assertions from authority. Those who question those assertions are deemed “bots” at best or “traitors” at worst.
Well here, fellow traitors, are the Top Ten reasons to question anything and everything the CIA – or any intelligence agency – has ever told you. … Read full article
This site is provided as a research and reference tool. Although we make every reasonable effort to ensure that the information and data provided at this site are useful, accurate, and current, we cannot guarantee that the information and data provided here will be error-free. By using this site, you assume all responsibility for and risk arising from your use of and reliance upon the contents of this site.
This site and the information available through it do not, and are not intended to constitute legal advice. Should you require legal advice, you should consult your own attorney.
Nothing within this site or linked to by this site constitutes investment advice or medical advice.
Materials accessible from or added to this site by third parties, such as comments posted, are strictly the responsibility of the third party who added such materials or made them accessible and we neither endorse nor undertake to control, monitor, edit or assume responsibility for any such third-party material.
The posting of stories, commentaries, reports, documents and links (embedded or otherwise) on this site does not in any way, shape or form, implied or otherwise, necessarily express or suggest endorsement or support of any of such posted material or parts therein.
The word “alleged” is deemed to occur before the word “fraud.” Since the rule of law still applies. To peasants, at least.
Fair Use
This site contains copyrighted material the use of which has not always been specifically authorized by the copyright owner. We are making such material available in our efforts to advance understanding of environmental, political, human rights, economic, democracy, scientific, and social justice issues, etc. We believe this constitutes a ‘fair use’ of any such copyrighted material as provided for in section 107 of the US Copyright Law. In accordance with Title 17 U.S.C. Section 107, the material on this site is distributed without profit to those who have expressed a prior interest in receiving the included information for research and educational purposes. For more info go to: http://www.law.cornell.edu/uscode/17/107.shtml. If you wish to use copyrighted material from this site for purposes of your own that go beyond ‘fair use’, you must obtain permission from the copyright owner.
DMCA Contact
This is information for anyone that wishes to challenge our “fair use” of copyrighted material.
If you are a legal copyright holder or a designated agent for such and you believe that content residing on or accessible through our website infringes a copyright and falls outside the boundaries of “Fair Use”, please send a notice of infringement by contacting atheonews@gmail.com.
We will respond and take necessary action immediately.
If notice is given of an alleged copyright violation we will act expeditiously to remove or disable access to the material(s) in question.
All 3rd party material posted on this website is copyright the respective owners / authors. Aletho News makes no claim of copyright on such material.


 Aletho News