Argo, Temperature, and OHC
By Willis Eschenbach | Whats Up With That? | March 2, 2014
I’ve been thinking about the Argo floats and the data they’ve collected. There are about 4,000 Argo floats in the ocean. Most of the time they are asleep, a thousand metres below the surface. Every 10 days they wake up and slowly rise to the surface, taking temperature measurements as they go. When they reach the surface, they radio their data back to headquarters, slip beneath the waves, sink down to a thousand metres and go back to sleep …
At this point, we have decent Argo data since about 2005. I’m using the Argo dataset 2005-2012, which has been gridded. Here, to open the bidding, are the ocean surface temperatures for the period.

Figure 1. Oceanic surface temperatures, 2005-2012. Argo data.
Dang, I like that … so what else can the Argo data show us?
Well, it can show us the changes in the average temperature down to 2000 metres. Figure 2 shows that result:
 Figure 2. Average temperature, surface down to 2,000 metres depth. Temperatures are volume-weighted.
The average temperature of the top 2000 metres is six degrees C (43°F). Chilly.
We can also take a look at how much the ocean has warmed and cooled, and where. Here are the trends in the surface temperature:
 Figure 3. Decadal change in ocean surface temperatures.
Once again we see the surprising stability of the system. Some areas of the ocean have warmed at 2° per decade, some have cooled at -1.5° per decade. But overall? The warming is trivially small, 0.03°C per decade.
Next, here is the corresponding map for the average temperatures down to 2,000 metres:
 Figure 4. Decadal change in average temperatures 0—2000 metres. Temperatures are volume-averaged.
Note that although the amounts of the changes are smaller, the trends at the surface are geographically similar to the trends down to 2000 metres.
Figure 5 shows the global average trends in the top 2,000 metres of the ocean. I have expressed the changes in another unit, 10^22 joules, rather than in °C, to show it as variations in ocean heat content.
 Figure 5. Global ocean heat content anomaly (10^22 joules). Same data as in Figure 4, expressed in different units.
The trend in this data (6.9 ± 0.6 e+22 joules per decade) agrees quite well with the trend in the Levitus OHC data, which is about 7.4 ± 0.8 e+22 joules per decade.
Anyhow, that’s the state of play so far. The top two kilometers of the ocean are warming at 0.02°C per decade … can’t say I’m worried by that.
Related articles


John Holdren’s Epic Fail
Watts Up With That? | March 1, 2014
From http://1.usa.gov/1mRYomm (PDF) I have converted the text for presentation here with Dr. Pielke’s response.
Dr. Roger Pielke responds:
I’m flattered that the White House has posted up an attack on me. Here is my response:
http://rogerpielkejr.blogspot.com/2014/03/john-holdrens-epic-fail.html
Please share far and wide.
Holdren’s letter is first, followed by Pielke’s response below.
============================================================
Drought and Global Climate Change: An Analysis of Statements by Roger Pielke Jr
By John P. Holdren – February 28, 2014
Introduction
In the question and answer period following my February 25 testimony on the Administration’s Climate Action Plan before the Oversight Subcommittee of the U.S. Senate’s Committee on Environment and Public Works, Senator Jeff Sessions (R-AL) suggested that I had misled the American people with comments I made to reporters on February 13, linking recent severe droughts in the American West to global climate change. To support this proposition, Senator Sessions quoted from testimony before the Environment and Public Works Committee the previous July by Dr. Roger Pielke, Jr., a University of Colorado political scientist. Specifically, the Senator read the following passages from Dr. Pielke’s written testimony:
It is misleading, and just plain incorrect, to claim that disasters associated with hurricanes, tornadoes, floods or droughts have increased on climate timescales either in the United States or globally.
Drought has “for the most part, become shorter, less, frequent, and cover a smaller portion of the U.S. over the last century”. Globally, “there has been little change in drought over the past 60 years.”
Footnotes in the testimony attribute the two statements in quotation marks within the second passage to the US Climate Change Science Program’s 2008 report on extremes in North America and a 2012 paper by Sheffield et al. in the journal Nature, respectively.
I replied that the indicated comments by Dr. Pielke, and similar ones attributed by Senator Sessions to Dr. Roy Spencer of the University of Alabama, were not representative of main- stream views on this topic in the climate-science community; and I promised to provide for the record a more complete response with relevant scientific references.
Dr. Pielke also commented directly, in a number of tweets on February 14 and thereafter, on my February 13 statements to reporters about the California drought, and he elaborated on the tweets for a blog post on The Daily Caller site (also on February 14). In what follows, I will address the relevant statements in those venues, as well. He argued there, specifically, that my statements on drought “directly contradicted scientific reports”, and in support of that assertion, he offered the same statements from his July testimony that were quoted by Senator Sessions (see above). He also added this:
The United Nations Intergovernmental Panel on Climate Change found that there is “not enough evidence at present to suggest more than low confidence in a global-scale observed trend in drought.”
In the rest of this response, I will show, first, that the indicated quote from the US Climate Change Science Program (CCSP) about U.S. droughts is missing a crucial adjacent sentence in the CCSP report, which supports my position about drought in the American West. I will also show that Dr. Pielke’s statements about global drought trends, while irrelevant to my comments about drought in California and the Colorado River Basin, are seriously misleading, as well, concerning what is actually in the UN Panel’s latest report and what is in the current scientific literature.
Drought trends in the American West
My comments to reporters on February 13, to which Dr. Pielke referred in his February 14 tweet and to which Senator Sessions referred in the February 25 hearing, were provided just ahead of President Obama’s visit to the drought-stricken California Central Valley and were explicitly about the drought situation in California and elsewhere in the West.
That being so, any reference to the CCSP 2008 report in this context should include not just the sentence highlighted in Dr. Pielke’s testimony but also the sentence that follows immediately in the relevant passage from that document and which relates specifically to the American West. Here are the two sentences in their entirety (http://downloads.globalchange.gov/sap/sap3- 3/Brochure-CCSP-3-3.pdf):
Similarly, long-term trends (1925-2003) of hydrologic droughts based on model derived soil moisture and runoff show that droughts have, for the most part, become shorter, less frequent, and cover a smaller portion of the U.S. over the last century (Andreadis and Lettenmaier, 2006). The main exception is the Southwest and parts of the interior of the West, where increased temperature has led to rising drought trends (Groisman et al., 2004; Andreadis and Lettenmaier, 2006).
Linking Drought to Climate Change
In my recent comments about observed and projected increases in drought in the American West, I mentioned four relatively well understood mechanisms by which climate change can play a role in drought. (I have always been careful to note that, scientifically, we cannot say that climate change caused a particular drought, but only that it is expected to increase the frequency, intensity, and duration of drought in some regions―and that such changes are being observed.)
The four mechanisms are:
1. In a warming world, a larger fraction of total precipitation falls in downpours, which means a larger fraction is lost to storm runoff (as opposed to being absorbed in soil).
2. In mountain regions that are warming, as most are, a larger fraction of precipitation falls as rain rather than as snow, which means lower stream flows in spring and summer.
3. What snowpack there is melts earlier in a warming world, further reducing flows later in the year.
4. Where temperatures are higher, losses of water from soil and reservoirs due to evaporation are likewise higher than they would otherwise be.
Regarding the first mechanism, the 2013 report of the IPCC’s Working Group I, The Science Basis (http://www.climatechange2013.org/images/report/WG1AR5_TS_FINAL.pdf, p 110), deems it “likely” (probability greater than 66%) that an increase in heavy precipitation events is already detectable in observational records since 1950 for more land areas than not, and that further changes in this direction are “likely over many land areas” in the early 21st century and “very likely over most of the mid-latitude land masses” by the late 21st century The second, third, and fourth mechanisms reflect elementary physics and are hardly subject to dispute (but see also additional references provided at the end of this comment).
As I have also noted in recent public comments, additional mechanisms have been identified by which changes in atmospheric circulation patterns that may be a result of global warming could be affecting droughts in the American West. There are some measurements and some analyses
suggesting that these mechanisms are operating, but the evidence is less than conclusive, and some respectable analysts attribute the indicated circulation changes to natural variability. The uncertainty about these mechanisms should not be allowed to become a distraction obscuring the more robust understandings about climate change and regional drought summarized above.
Global Drought Patterns
Drought is by nature a regional phenomenon. In a world that is warming on the average, there will be more evaporation and therefore more precipitation; that is, a warming world will also get wetter, on the average. In speaking of global trends in drought, then, the meaningful questions are (a) whether the frequency, intensity, and duration of droughts are changing in most or all of the regions historically prone to drought and (b) whether the total area prone to drought is changing.
Any careful reading of the 2013 IPCC report and other recent scientific literature about on the subject reveals that droughts have been worsening in some regions in recent decades while lessening in other regions, and that the IPCC’s “low confidence” about a global trend relates mainly to the question of total area prone to drought and a lack of sufficient measurements to settle it. Here is the key passage from the Technical Summary from IPCC WGI’s 2013 report (http://www.climatechange2013.org/images/report/WG1AR5_TS_FINAL.pdf, p 112):
Compelling arguments both for and against significant increases in the land area affected by drought and/or dryness since the mid-20th century have resulted in a low confidence assessment of observed and attributable large-scale trends. This is due primarily to a lack and quality of direct observations, dependencies of inferred trends on the index choice, geographical inconsistencies in the trends and difficulties in distinguishing decadal scale variability from long term trends.
The table that accompanies the above passage from the IPCC’s report―captioned “Extreme weather and climate events: global-scale assessment of recent observed changes, human contribution to the changes, and projected further changes for the early (2016-2035) and late (2081-2100) 21st century”―has the following entries for “Increases in intensity and/or duration of drought”: under changes observed since 1950, “low confidence on a global scale, likely changes in some regions” [emphasis added]; and under projected changes for the late 21st century, “likely (medium confidence) on a regional to global scale”.
Dr. Pielke’s citation of a 2012 paper from Nature by Sheffield et al., entitled “Little change in global drought over the past 60 years”, is likewise misleading. That paper’s abstract begins as follows:
Drought is expected to increase in frequency and severity in the future as a result of climate change, mainly as a consequence of decreases in regional precipitation but also because of increasing evaporation driven by global warming1-3. Previous assessments of historic changes in drought over the late twentieth and early twenty-first centuries indicate that this may already be happening globally. In particular, calculations of the Palmer Drought Severity Index (PDSI) show a decrease in moisture globally since the 1970s with a commensurate increase in the area of drought that is attributed, in part, to global warming4-5.
The paper goes on to argue that the PDSI, which has been relied upon for drought characteriza- tion since the 1960s, is too simple a measure and may (the authors’ word) have led to over- estimation of global drought trends in previous climate-change assessments―including the IPCC’s previous (2007) assessment, which found that “More intense and longer droughts have been observed over wider areas since the 1970s, particularly in the tropics and subtropics.”
The authors argue for use of a more complex index of drought, which, however, requires more data and more sophisticated models to apply. Their application of it with the available data shows a smaller global drought trend than calculated using the usual PDSI, but they conclude that better data are needed. The conclusion of the Sheffield et al. paper has proven controversial, with some critics pointing to the inadequacy of existing observations to support the more complex index and others arguing that a more rigorous application of the new approach leads to results similar to those previously obtained using the PDSI.
A measure of the differences of view on the topic is available in a paper entitled “Increasing drought under global warming in observations and models”, published in Nature Climate Change at about the same time as Sheffield et al. by a leading drought expert at the National Center for Climate Research, Dr. Aiguo Dai. Dr. Dai’s abstract begins and ends as follows:
Historical records of precipitation, streamflow, and drought indices all show increased aridity since 1950 over many land areas1,2. Analyses of model-simulated soil moisture3, 4, drought indices1,5,6, and precipitation minus evaporation7 suggest increased risk of drought in the twenty-first century. … I conclude that the observed global aridity changes up to 2010 are consistent with model predictions, which suggest severe and widespread droughts in the next 30-90 years over many land areas resulting from either decreased precipitation and/or increased evaporation.
The disagreement between the Sheffield et al. and Dai camps appears to have been responsible for the IPCC’s downgrading to “low confidence”, in its 2013 report, the assessment of an upward trend in global drought in its 2007 Fourth Assessment and its 2012 Special Report on Extreme Events (http://www.ipcc-wg2.gov/SREX/) .
Interestingly, a number of senior parties to the debate―including Drs. Sheffield and Dai―have recently collaborated on a co-authored paper, published in the January 2014 issue of Nature Climate Change, entitled “Global warming and changes in drought”. In this new paper, the authors identify the reasons for their previous disagreements; agree on the need for additional data to better separate natural variability from human-caused trends; and agree on the following closing paragraph (quoted here in full):
Changes in the global water cycle in response to the warming over the twenty-first century will not be uniform. The contrast in precipitation between wet and dry regions and between wet and dry seasons will probably increase, although there may be regional exceptions.
Climate change is adding heat to the climate system and on land much of that heat goes into drying. A natural drought should therefore set in quicker, become more intense, and may last longer. Droughts may be more extensive as a result. Indeed, human-induced warming effects accumulate on land during periods of drought because the ‘air conditioning effects’ of water are absent. Climate change may not manufacture droughts, but it could exacerbate them and it will probably expand their domain in the subtropical dry zone.
Additional References (with particularly relevant direct quotes in italics)
Christopher R. Schwalm et al., Reduction of carbon uptake during turn of the century drought in western North America, Nature Geoscience, vol. 5, August 2012, pp 551-556.
The severity and incidence of climatic extremes, including drought, have increased as a result of climate warming. … The turn of the century drought in western North America was the most severe drought over the past 800 years, significantly reducing the modest carbon sink normally present in this region. Projections indicate that drought events of this length and severity will be commonplace through the end of the twenty-first century.
Gregory T. Pederson et al., The unusual nature of recent snowpack declines in the North American Cordillera, Science, vol. 333, 15 July 2011, pp 332-335.
Over the past millennium, late 20th century snowpack reductions are almost unprecedented in magnitude across the northern Rocky Mountains and in their north-south synchrony across the cordillera. Both the snowpack declines and their synchrony result from unparalleled springtime warming that is due to positive reinforcement of the anthropogenic warming by decadal variability. The increasing role of warming on large-scale snowpack variability and trends foreshadows fundamental impacts on streamflow and water supplies across the western United States.
Gregory T. Pederson et al., Regional patterns and proximal causes of the recent snowpack decline in the Rocky Mountains, US, Geophysical Research Letters, vol. 40, 16 May 2013, pp 1811-1816.
The post-1980 synchronous snow decline reduced snow cover at low to middle elevations by
~20% and partly explains earlier and reduced streamflow and both longer and more active fire seasons. Climatologies of Rocky Mountain snowpack are shown to be seasonally and regionally complex, with Pacific decadal variability positively reinforcing the anthropogenic warming trend.
Michael Wehner et al., Projections of future drought in the continental United States and Mexico, Journal of Hydrometeorology, vol. 12, December 2011, pp 1359-1377.
All models, regardless of their ability to simulate the base-period drought statistics, project significant future increases in drought frequency, severity, and extent over the course of the 21st century under the SRES A1B emissions scenario. Using all 19 models, the average state in the last decade of the twenty-first century is projected under the SRES A1B forcing scenario to be conditions currently considered severe drought (PDSI<-3) over much of the continental United States and extreme drought (PDSI<-4) over much of Mexico.
D. R. Cayan et al., Future dryness in the southwest US and the hydrology of the early 21st century drought, Proceedings of the National Academy of Sciences, vol. 107, December 14, 2010, pp 21271-21276.
Although the recent drought may have significant contributions from natural variability, it is notable that hydrological changes in the region over the last 50 years cannot be fully explained by natural variability, and instead show the signature of anthropogenic climate change.
E. P. Maurer et al., Detection, attribution, and sensitivity of trends toward earlier streamflow in the Sierra Nevada, Journal of Geophysical Research, vol. 112, 2007, doi:10.1029/2006JD08088.
The warming experienced in recent decades has caused measurable shifts toward earlier streamflow timing in California. Under future warming, further shifts in streamflow timing are projected for the rivers draining the western Sierra Nevada, including the four considered in this study. These shifts and their projected increases through the end of the 21st century will have dramatic impacts on California’s managed water system.
H. G. Hidalgo et al., Detection and attribution of streamflow timing changes to climate change in the western United States, Journal of Climate, vol. 22, issue 13, 2009, pp 3838-3855, doi: 10.1175/2009JCLI2740.1.
The advance in streamflow timing in the western United States appears to arise, to some measure, from anthropogenic warming. Thus the observed changes appear to be the early phase of changes expected under climate change. This finding presages grave consequences for the water supply, water management, and ecology of the region. In particular, more winter and spring flooding and drier summers are expected as well as less winter snow (more rain) and earlier snowmelt.
==============================================================
John Holdren’s Epic Fail
By Roger Pielke, Jr. – 3/01/2014

Last week in a Congressional hearing, John Holdren, the president’s science advisor, characterized me as being outside the “scientific mainstream” with respect to my views on extreme events and climate change. Specifically, Holdren was responding directly to views that I provided in Senate testimony that I gave last July (and here in PDF).
To accuse an academic of holding views that lie outside the scientific mainstream is the sort of delegitimizing talk that is of course common on blogs in the climate wars. But it is rare for political appointee in any capacity — the president’s science advisor no less — to accuse an individual academic of holding views are are not simply wrong, but in fact scientifically illegitimate. Very strong stuff.
Given the seriousness of Holdren’s charges and the possibility of negative professional repercussions via email I asked him to elaborate on his characterization, to which he replied quite quickly that he would do so in the form of a promised follow-up to the Senate subcommittee.
Here is what I sent him:
Dear John-
I hope this note finds you well. I am writing in response to your characterization of me before the Senate Environment and Public Works Committee’s Subcommittee on Oversight yesterday, in which you said that my views lie “outside the scientific mainstream.”
This is a very serious charge to make in Congressional testimony about a colleague’s work, even more so when it comes from the science advisor to the president.
The context of your comments about me was an exchange that you had with Senator Sessions over my recent testimony to the full EPW Committee on the subject of extreme events. You no doubt have seen my testimony (having characterized it yesterday) and which is available here:
http://sciencepolicy.colorado.edu/admin/publication_files/2013.20.pdf
Your characterization of my views as lying “outside the scientific mainstream” is odd because the views that I expressed in my testimony are entirely consonant with those of the IPCC (2012, 2013) and those of the US government’s USGCRP. Indeed, much of my testimony involved reviewing the recent findings of IPCC SREX and AR5 WG1. My scientific views are also supported by dozens of peer reviewed papers which I have authored and which have been cited thousands of times, including by all three working groups of the IPCC. My views are thus nothing if not at the center of the “scientific mainstream.”
I am writing to request from you the professional courtesy of clarifying your statement. If you do indeed believe that my views are “outside the scientific mainstream” could you substantiate that claim with evidence related specifically to my testimony which you characterized pejoratively? Alternatively, if you misspoke, I’d request that you set the record straight to the committee.
I welcome your response at your earliest opportunity.
Today he has shared with me a 6-page single space response which he provided to the Senate subcommittee titled “Critique of Pielke Jr. Statements on Drought.” Here I take a look at Holdren’s response.
In a nutshell, Holdren’s response is sloppy and reflects extremely poorly on him. Far from showing that I am outside the scientific mainstream, Holdren’s follow-up casts doubt on whether he has even read my Senate testimony. Holdren’s justification for seeking to use his position as a political appointee to delegitimize me personally reflects poorly on his position and office, and his response simply reinforces that view.
His response, (which you can see here in full in PDF) focuses entirely on drought — whereas my testimony focused on hurricanes, floods, tornadoes and drought. But before he gets to drought, Holdren gets off to a bad start in his response when he shifts the focus away from my testimony and to some article in a website called “The Daily Caller” (which is apparently some minor conservative or Tea Party website, and the article appears to be this one).
Holdren writes:
Dr. Pielke also commented directly, in a number of tweets on February 14 and thereafter, on my February 13 statements to reporters about the California drought, and he elaborated on the tweets for a blog post on The Daily Caller site (also on February 14). In what follows, I will address the relevant statements in those venues, as well. He argued there, specifically, that my statements on drought “directly contradicted scientific reports”, and in support of that assertion, he offered the same statements from his July testimony that were quoted by Senator Sessions.
Let me be quite clear — I did not write anything for “The Daily Caller” nor did I speak or otherwise communicate to anyone there. The quote that Holdren attributes to me – “directly contradicted scientific reports” — is actually written by “The Daily Caller.” Why that blog has any relevance to my standing in the “scientific mainstream” eludes me, but whatever. This sort of sloppiness is inexcusable.
Leaving the silly misdirection aside — common on blogs but unbecoming of the science advisor to the most powerful man on the planet — let’s next take a look at Holdren’s substantive complaints about my recent Senate testimony.
As a starting point, let me reproduce in its entirety the section of my Senate testimony (here in PDF) which discussed drought.
Drought
What the IPCC SREX (2012) says:
- “There is medium confidence that since the 1950s some regions of the world have experienced a trend to more intense and longer droughts, in particular in southern Europe and West Africa, but in some regions droughts have become less frequent, less intense, or shorter, for example, in central North America and northwestern Australia.”
- For the US the CCSP (2008)20 says: “droughts have, for the most part, become shorter, less frequent, and cover a smaller portion of the U. S. over the last century.”21
What the data says:
8. Drought has “for the most part, become shorter, less frequent, and cover a smaller portion of the U. S. over the last century.”22
Figure 8. Figure 2.6 from CCSP (2008) has this caption: “The area (in percent) of area in severe to extreme drought as measured by the Palmer Drought Severity Index for the United States (red) from 1900 to present and for North America (blue) from 1950 to present.”Note: Writing in Nature Senevirnate (2012) argues with respect to global trends that, “there is no necessary correlation between temperature changes and long-term drought variations, which should warn us against using any simplifications regarding their relationship.”23
Footnotes:
20 CCSP, 2008: Weather and Climate Extremes in a Changing Climate. Regions of Focus: North America, Hawaii, Caribbean, and U.S. Pacific Islands. A Report by the U.S. Climate Change Science Program and the Subcommittee on Global Change Research. [Thomas R. Karl, Gerald A. Meehl, Christopher D. Miller, Susan J. Hassol, Anne M. Waple, and William L. Murray (eds.)]. Department of Commerce, NOAA’s National Climatic Data Center, Washington, D.C., USA, 164 pp.
21 CCSP (2008) notes that “the main exception is the Southwest and parts of the interior of the West, where increased temperature has led to rising drought trends.”
22 This quote comes from the US Climate Change Science Program’s 2008 report on extremes in North America.
23 http://www.nature.com/nature/journal/v491/n7424/full/491338a.htm

Let’s now look at Holdren’s critique which he claims places me “outside the scientific mainstream.”
Holdren Complaint #1: ”I will show, first, that the indicated quote [RP: This one: ““droughts have, for the most part, become shorter, less frequent, and cover a smaller portion of the U. S. over the last century.”21”] from the US Climate Change Science Program (CCSP) about U.S. droughts is missing a crucial adjacent sentence in the CCSP report, which supports my position about drought in the American West. . . That being so, any reference to the CCSP 2008 report in this context should include not just the sentence highlighted in Dr. Pielke’s testimony but also the sentence that follows immediately in the relevant passage from that document and which relates specifically to the American West.”
What is that sentence is question from the CCSP 2008 report that Holdren thinks I should have included in my testimony? He says it is this one:
“The main exception is the Southwest and parts of the interior of the West, where increased temperature has led to rising drought trends.”
Readers (not even careful readers) can easily see Footnote 21 from my testimony, which states:
CCSP (2008) notes that “the main exception is the Southwest and parts of the interior of the West, where increased temperature has led to rising drought trends.”
Um, hello? Is this really coming from the president’s science advisor?
Holdren is flat-out wrong to accuse me of omitting a key statement from my testimony. Again, remarkable, inexcusable sloppiness.
Holdren’s reply next includes a section on drought and climate change which offers no critique of my testimony, and which needs no response from me.
Holdren Complaint #2: Holdren implies that I neglected to note the IPCC’s reference to the fact that drought is a regional phenomena: “Any careful reading of the 2013 IPCC report and other recent scientific literature about on the subject reveals that droughts have been worsening in some regions in recent decades while lessening in other regions.”
Again, even a cursory reading of what I quoted from the IPCC shows that Holdren’s complaint does not stand up. Here is the full quote that I included in my testimony from the IPCC on drought:
“There is medium confidence that since the 1950s some regions of the world have experienced a trend to more intense and longer droughts, in particular in southern Europe and West Africa, but in some regions droughts have become less frequent, less intense, or shorter, for example, in central North America and northwestern Australia.”
Again, hello? Seriously?
Holdren Complaint #3: Near as I can tell Holdren is upset that I cited a paper from Nature that he does not like, writing, “Dr. Pielke’s citation of a 2012 paper from Nature by Sheffield et al., entitled “Little change in global drought over the past 60 years”, is likewise misleading.”
He points to a January 2014 paper in Nature Climate Change as offering a rebuttal to Sheffield et al. (2012).
The first point to note in response is that my citing of a paper which appears in Nature does not provide evidence of my being “outside the scientific mainstream” no matter how much Holdren disagrees with the paper. Academics in the “scientific mainstream” cite peer-reviewed papers, sometimes even those in Nature. Second, my testimony was delivered in July, 2013 and the paper he cites as a rebuttal was submitted in August, 2013 and only published in early 2014. I can hardly be faulted for not citing a paper which had not yet appeared. Third, that 2014 paper that Holdren likes better actually supports the IPCC conclusions on drought and my characterization of them in my Senate testimony.The authors write:
How is drought changing as the climate changes? Several recent papers in the scientific literature have focused on this question but the answer remains blurred.
The bottom line here is that this is an extremely poor showing by the president’s science advisor. It is fine for experts to openly disagree. But when a political appointee uses his position not just to disagree on science or policy but to seek to delegitimize a colleague, he has gone too far.
Solar warnings, global warming and crimes against humanity
Malaysian Realist
We’ve been seeing a lot of unexpectedly cool weather across the world. While this may be explained by local phenomenon such as the Northeast Monsoon in Malaysia and the Polar Vortex in the USA, a longer term trend of worldwide cooling is headed our way.
I say this because the sun – the main source of light and heat for our planet – is approaching a combined low point in output. Solar activity rises and falls in different overlapping cycles, and the low points of several cycles will coincide in the near future:
A) 11-year Schwabe Cycle which had a minimum in 2008 and is due for the next minimum in 2019, then 2030. Even at its recent peak (2013) the sun had its lowest recorded activity in 200 years.
B) 87-year Gleissberg cycle which has a currently ongoing minimum period from 1997 – 2032, corresponding to the observed ‘lack of global warming’ (more on that later).
C) 210-year Suess cycle which has its next minimum predicted to be around 2040.
Hence, solar output will very likely drop to a substantial low around 2030 – 2040. This may sound pleasant for Malaysians used to sweltering heat, but it is really not a matter to be taken lightly. Previous lows such as the Year Without A Summer (1816) and the Little Ice Age (16th to 19th century) led to many deaths worldwide from crop failures, flooding, superstorms and freezing winters.
But what about the much-ballyhooed global warming, allegedly caused by increasing CO2 levels in the atmosphere? Won’t that more than offset the coming cooling, still dooming us all to a feverish Earth?
Regarding this matter, it is now a plainly accepted fact that there has been no global temperature rise in the past 25 years. This lack of warming is openly admitted by: NASA; The UK Met Office; the University of East Anglia Climatic Research Unit, as well as its former head Dr. Phil Jones (of the Climategate data manipulation controversy); Hans von Storch (Lead Author for Working Group I of the IPCC); James Lovelock (inventor of the Gaia Theory); and media entities the BBC, Forbes, Reuters, The Australian, The Economist, The New York Times, and The Wall Street Journal.
And this is despite CO2 levels having risen more than 13%, from 349 ppm in 1987 to 396ppm today. The central thesis of global warming theory – that rising CO2 levels will inexorably lead to rising global temperatures, followed by environmental catastrophe and massive loss of human life – is proven false.

(All the above are clearly and cleanly depicted by graphs, excerpts, citations and links in my collection at http://globalwarmingisunfactual.wordpress.com – as a public service.)
This is probably why anti-CO2 advocates now warn of ‘climate change’ instead. But pray tell, exactly what mechanism is there for CO2 to cause climate change if not by warming? The greenhouse effect has CO2 trapping solar heat and thus raising temperatures – as we have been warned ad nauseum by climate alarmists – so how does CO2 cause climate change when there is no warming?
Solar activity is a far larger driver of global temperature than CO2 levels, because after all, without the sun there would be no heat for greenhouse gases to trap in the first place. (Remember what I said about the Gleissberg cycle above?)
And why is any of this important to you and I? It matters because countless resources are being spent to meet the wrong challenges. Just think of all the time, energy, public attention and hard cash that have already been squandered on biofuel mandates, subsidies for solar panels and wind turbines, carbon caps and credits, bloated salaries of dignitaries, annual jet-setting climate conferences in posh five-star hotels… To say nothing of the lost opportunities and jobs (two jobs lost for every one ‘green’ job created in Spain, which now has 26% unemployment!). And most of the time it is the common working man, the taxpayer, you and I who foot the bill.
What if all this immense effort and expenditure had been put towards securing food and clean water for the impoverished (combined 11 million deaths/year)? Or fighting dengue and malaria (combined 1.222 million deaths/year)? Or preserving rivers, mangroves, rainforests and endangered species? Or preparing power grids for the increased demand that more severe winters will necessitate – the same power grids now crippled by shutting down reliable coal plants in favour of highly intermittent wind turbines?
In the face of such dire needs that can be met immediately and effectively, continuing to throw away precious money to ‘possibly, perhaps, maybe one day’ solve the non-problem of CO2 emissions is foolish, arrogant and arguably malevolent. To wit, the UN World Food Programme just announced that they are forced to scale back aid to some of the 870 million malnourished worldwide due to a $1 billion funding shortfall and the challenges of the ongoing Syrian crisis. To put this is context, a billion is a mere pittance next to the tens of billions already flushed away by attempted adherence to the Kyoto Protocol (€6.2 billion for just Germany in just 2005 alone!).
During the high times for global warmist doomsaying, sceptics and realists who questioned the unproven theories were baselessly slandered as ‘anti-science’, ‘deniers’, ‘schills for big oil’… Or even ‘war criminals’ deserving Nuremberg-style trials for their ‘crimes against humanity’!
Now that the tables are turned, just let it be known that it was not the sceptics who flushed massive amounts of global resources down the drain – while genuine human and environmental issues languished and withered in the empty shadow of global warming hysteria. Crimes against humanity, indeed.
Related articles


Andrew Revkin Loses The Plot, Episode XXXVIII
By Willis Eschenbach | Watts Up With That? | February 22, 2014
I went over to Andy Revkin’s site to be entertained by his latest fulminations against “denialists”. Revkin, as you may remember from the Climategate emails, was the main go-to media lapdog for the various unindicted Climategate co-conspirators. His latest post is a bizarre mishmash of allegations, bogus claims, and name-calling. Most appositely, given his history of blind obedience to his oh-so-scientific masters like Phil Jones and Michael Mann, he illustrated it with this graphic which presumably shows Revkin’s response when confronted with actual science:

I was most amused, however, to discover what this man who claims to be reporting on science has to say about the reason for the very existence of his blog:
By 2050 or so, the human population is expected to reach nine billion, essentially adding two Chinas to the number of people alive today. Those billions will be seeking food, water and other resources on a planet where, scientists say, humans are already shaping climate and the web of life. In Dot Earth, which moved from the news side of The Times to the Opinion section in 2010, Andrew C. Revkin examines efforts to balance human affairs with the planet’s limits. Conceived in part with support from a John Simon Guggenheim Fellowship, Dot Earth tracks relevant developments from suburbia to Siberia.
Really? Let’s look at the numbers put up by this charmingly innumerate fellow.
Here’s how the numbers play out. I agree with Revkin, most authorities say the population will top out at about nine billion around 2050. I happen to think they are right, not because they are authorities, but because that’s what my own analysis of the numbers has to say. Hey, color me skeptical, I don’t believe anyone’s numbers.
In any case, here are the FAO numbers for today’s population:
PRESENT GLOBAL POPULATION: 7.24 billion
PRESENT CHINESE POPULATION: 1.40 billion
PRESENT POPULATION PLUS REVKIN’S “TWO CHINAS”: 10.04 billion
So Revkin is only in error by one billion people … but heck, given his historic defense of scientific malfeasance, and his ludicrous claims about “denialists” and “denialism”, that bit of innumeracy pales by comparison.
Despite that, Revkin’s error is not insignificant. From the present population to 9 billion, where the population is likely to stabilize, is an increase of about 1.75 billion. IF Revkin’s claims about two Chinas were correct, the increase would be 2.8 billion. So his error is 2.8/1.75 -1, which means his numbers are 60% too high. A 60% overestimation of the size of the problem that he claims to be deeply concerned about? … bad journalist, no cookies.
Now, for most science reporters, a 60% error in estimating the remaining work to be done on the problem they’ve identified as the most important of all issues, the problem they say is the raison d’etre of their entire blog … well, that kind of a mistake would matter to them. They would hasten to correct an error of that magnitude. For Revkin, however, a 60% error is lost in the noise of the rest of his ludicrous ideas and his endless advocacy for shonky science …
My prediction? He’ll leave the bogus alarmist population claim up there on his blog, simply because a “denialist” pointed out his grade-school arithmetic error, and changing even a jot or a tittle in response to a “denialist” like myself would be an unacceptable admission of fallibility …
My advice?
Don’t get your scientific info from a man who can’t add to ten … particularly when he is nothing but a pathetic PR shill for bogus science and disingenuous scientists …
CRISES IN CLIMATOLOGY
By Donald C. Morton | Watts Up With That? | February 17, 2014
Herzberg Program in Astronomy and Astrophysics, National Research Council of Canada
ABSTRACT
The Report of the Intergovernmental Panel on Climate Change released in September 2013 continues the pattern of previous ones raising alarm about a warming earth due to anthropogenic greenhouse gases. This paper identifies six problems with this conclusion – the mismatch of the model predictions with the temperature observations, the assumption of positive feedback, possible solar effects, the use of a global temperature, chaos in climate, and the rejection of any skepticism.
THIS IS AN ASTROPHYSICIST’S VIEW OF CURRENT CLIMATOLOGY. I WELCOME CRITICAL COMMENTS.
1. INTRODUCTION
Many climatologists have been telling us that the environment of the earth is in serious danger of overheating caused by the human generation of greenhouse gases since the Industrial Revolution. Carbon dioxide (CO2) is mainly to blame, but methane (CH4), nitrous oxide (N2O) and certain chlorofluorocarbons also contribute.
“As expected, the main message is still the same: the evidence is very clear that the world is warming, and that human activities are the main cause. Natural changes and fluctuations do occur but they are relatively small.” – John Shepard in the United Kingdom, 2013 Sep 27 for the Royal Society.
“We can no longer ignore the facts: Global warming is unequivocal, it is caused by us and its consequences will be profound. But that doesn’t mean we can’t solve it.” -Andrew Weaver in Canada, 2013 Sep 28 in the Globe and Mail.
“We know without a doubt that gases we are adding to the air have caused a planetary energy imbalance and global warming, already 0.8 degrees Celsius since pre-industrial times. This warming is driving an increase in extreme weather from heat waves to droughts and wild fires and stronger storms . . .” – James Hansen in United States, 2013 Dec 6 CNN broadcast.
Are these views valid? In the past eminent scientists have been wrong. Lord Kelvin, unaware of nuclear fusion, concluded that the sun’s gravitational energy could keep it shining at its present brightness for only 107 years. Sir Arthur Eddington correctly suggested a nuclear source for the sun, but rejected Subrahmanyan Chandrasekhar’s theory of degenerate matter to explain white dwarfs. In 1983 Chandrasekhar received the Nobel Prize in Physics for his insight.
My own expertise is in physics and astrophysics with experience in radiative transfer, not climatology, but looking at the discipline from outside I see some serious problems. I presume most climate scientists are aware of these inconsistencies, but they remain in the Reports of the Intergovernmental Panel on Climate Change (IPCC), including the 5th one released on 2013 Sep 27. Politicians and government officials guiding public policy consult these reports and treat them as reliable.
2. THEORY, MODELS AND OBSERVATIONS
A necessary test of any theory or model is how well it predicts new experiments or observations not used in its development. It is not sufficient just to represent the data used to produce the theory or model, particularly in the case of climate models where many physical processes too complicated to code explicitly are represented by adjustable parameters. As John von Neumann once stated “With four parameters I can fit an elephant, and with five I can make him wiggle his trunk.” Four parameters will not produce all the details of an elephant, but the principle is clear. The models must have independent checks.

Fig. 1. Global Average Temperature Anomaly (°C) upper, and CO2 concentration (ppm) lower graphs from http://www.climate.gov/maps-data by the U.S. National Oceanic and Atmospheric Administration. The extension of the CO2 data to earlier years is from the ice core data of the Antarctic Law Dome ftp://ftp.ncdc.noaa.gov/pub/data/paleo/icecore/antarctica/law/law_co2.txt.
The upper plot in Fig. 1 shows how global temperatures have varied since 1880 with a decrease to 1910, a rise until 1945, a plateau to 1977, a rise of about 0.6 ºC until 1998 and then essentially constant for the next 16 years. Meanwhile, the concentration of CO2 in our atmosphere has steadily increased. Fig. 2 from the 5th Report of the Intergovernmental Panel on Climate Change (2013) shows that the observed temperatures follow the lower envelope of the predictions of the climate models.

Fig. 2. Model Predictions and Temperature Observations from IPCC Report 2013. RCP 4.5 (Representative Concentration Pathway 4.5) labels a set of models for a modest rise in anthropogenic greenhouse gases corresponding to an increase of 4.5 Wm–2 (1.3%) in total solar irradiance.
Already in 2009 climatologists worried about the change in slope of the temperature curve. At that time Knight et al. (2009) asked the rhetorical question “Do global temperature trends over the last decade falsify climate predictions?” Their response was “Near-zero and even negative trends are common for intervals of a decade or less in the simulations, due to the model’s internal climate variability. The simulations rule out (at the 95% level) zero trends for intervals of 15 yr or more, suggesting that an observed absence of warming of this duration is needed to create a discrepancy with the expected present-day warming rate.”
Now some climate scientists are saying that 16 years is too short a time to assess a change in climate, but then the rise from 1978 to 1998, which was attributed to anthropogenic CO2, also could be spurious. Other researchers are actively looking into phenomena omitted from the models to explain the discrepancy. These include
1) a strong natural South Pacific El Nino warming event in 1998 so the plateau did not begin until 2001,
2) an overestimate of the greenhouse effect in some models,
3) inadequate inclusion of clouds and other aerosols in the models, and
4) a deep ocean reservoir for the missing heat.
Extra warming due to the 1978 El Nino seems plausible, but there have been others that could have caused some of the earlier warming and there are also cooling La Nina events. All proposed causes of the plateau must have their effects on the warming also incorporated into the models to make predictions that then can be tested during the following decade or two of temperature evolution.
3. THE FEEDBACK PARAMETER
There is no controversy about the basic physics that adding CO2 to our atmosphere absorbs solar energy resulting in a little extra warming on top of the dominant effect of water vapor. The CO2 spectral absorption is saturated so is proportional to the logarithm of the concentration. The estimated effect accounts for only about half the temperature rise of 0.8 ºC since the Industrial Revolution. Without justification the model makers ignored possible natural causes and assumed the rise was caused primarily by anthropogenic CO2 with reflections by clouds and other aerosols approximately cancelling absorption by the other gases noted above. Consequently they postulated a positive feedback due to hotter air holding more water vapor, which increased the absorption of radiation and the backwarming. The computer simulations represented this process and many other effects by adjustable parameters chosen to match the observations. As stated on p. 9-9 of IPCC2013, “The complexity of each process representation is constrained by observations, computational resources, and current knowledge.” Models that did not show a temperature rise would have been omitted from any ensemble so the observed rise effectively determined the feedback parameter.
Now that the temperature has stopped increasing we see that this parameter is not valid. It even could be negative. CO2 absorption without the presumed feedback will still happen but its effect will not be alarming. The modest warming possibly could be a net benefit with increased crop production and fewer deaths due to cold weather.
4. THE SUN
The total solar irradiance, the flux integrated over all wavelengths, is a basic input to all climate models. Fortunately our sun is a stable star with minimal change in this output. Since the beginning of satellite measures of the whole spectrum in 1978 the variation has been about 0.1% over the 11-year activity cycle with occasional excursions up to 0.3%. The associated change in tropospheric temperature is about 0.1 ºC.
Larger variations could explain historical warm and cold intervals such as the Medieval Warm Period (approx. 950 – 1250) and the Little Ice Age (approx. 1430 – 1850) but remain as speculations. The sun is a ball of gas in hydrostatic equilibrium. Any reduction in the nuclear energy source initially would be compensated by a gravitational contraction on a time scale of a few minutes. Complicating this basic picture are the variable magnetic field and the mass motions that generate it. Li et al. (2003) included these effects in a simple model and found luminosity variations of 0.1%, consistent with the measurements.
However, the sun can influence the earth in many other ways that the IPCC Report does not consider, in part because the mechanisms are not well understood. The ultraviolet irradiance changes much more with solar activity, ~ 10% at 200 nm in the band that forms ozone in the stratosphere and between 5% and 2% in the ozone absorption bands between 240 and 320 nm according to DeLand & Cebula (2012). Their graphs also show that these fluxes during the most recent solar minimum were lower than the previous two reducing the formation of ozone in the stratosphere and its absorption of the near UV spectrum. How this absorption can couple into the lower atmosphere is under current investigation, e. g. Haigh et al. (2010).

Fig. 3 – Monthly averages of the 10.7 cm solar radio flux measured by the National Research Council of Canada and adjusted to the mean earth-sun distance. A solar flux unit = 104 Jansky = 10-22 Wm-2 Hz-1. The maximum just past is unusually weak and the preceding minimum exceptionally broad. Graph courtesy of Dr. Ken Tapping of NRC.
Decreasing solar activity also lowers the strength of the heliosphere magnetic shield permitting more galactic cosmic rays to reach the earth. Experiments by Kirkby et al. (2011) and Svensmark et al. (2013) have shown that these cosmic rays can seed the formation of clouds, which then reflect more sunlight and reduce the temperature, though the magnitude of the effect remains uncertain. Morton (2014) has described how the abundances cosmogenic isotopes 10Be and 14C in ice cores and tree rings indicate past solar activity and its anticorrelation with temperature.
Of particular interest is the recent reduction in solar activity. Fig. 3 shows the 10.7 cm solar radio flux measured by the National Research Council of Canada since 1947 (Tapping 2013) and Fig. 4 the corresponding sunspot count. Careful calibration of the radio flux permits reliable comparisons

Fig. 4. Monthly sunspot numbers for the past 60 years by the Royal Observatory of Belgium at http://sidc.oma.be/sunspot-index-graphics/sidc_graphics.php.
over six solar cycles even when there are no sunspots. The last minimum was unusually broad and the present maximum exceptionally weak. The sun has entered a phase of low activity. Fig. 5 shows that previous times of very low activity were the Dalton Minimum from about 1800 to 1820 and the Maunder Minimum from about 1645 to 1715 when very few spots were seen. Since these minima occurred during the Little Ice Age when glaciers were advancing in both Northern and Southern Hemispheres, it is possible that we are entering another cooling period. Without a physical understanding of the cause of such cool periods, we cannot be more specific. Temperatures as cold as the Little Ice Age may not happen, but there must be some cooling to compensate the heating that is present from the increasing CO2 absorption.
Regrettably the IPCC reports scarcely mention these solar effects and the uncertainties they add to any prediction.
5. THE AVERAGE GLOBAL TEMPERATURE
Long-term temperature measurements at a given location provide an obvious test of climate change. Such data exist for many places for more than a hundred years and for a few places for much longer. With these data climatologists calculate the temperature anomaly – the deviation from a many-year average such as 1961 to 1990, each day of the year at the times a measurement is recorded. Then they average over days, nights, seasons, continents and oceans to obtain the mean global temperature anomaly for each month or year as in Fig. 1. Unfortunately many parts of the world are poorly sampled and the oceans, which cover 71% of the earth’s surface, even less so. Thus many measurements must be extrapolated to include larger areas with different climates. Corrections are needed when a site’s measurements are interrupted or terminated or a new station is established as well as for urban heat if the meteorological station is in a city and altitude if the station is significantly higher than sea level.

Fig. 5. This plot from the U. S. National Oceanic and Atmospheric Agency shows sunspot numbers since their first observation with telescopes in 1610. Systematic counting began soon after the discovery of the 11-year cycle in 1843. Later searching of old records provided the earlier numbers.
The IPCC Reports refer to four sources of data for the temperature anomaly from the Hadley Centre for Climate Prediction and Research and the European Centre for Medium-range Weather Forcasting in the United Kingdom and the Goddard Institute for Space Science and the National Oceanic and Atmospheric Administration in the United States. For a given month they can differ by several tenths of a degree, but all show the same long-term trends of Fig. 1, a rise from 1978 to 1998 and a plateau from 1998 to the present.
These patterns continue to be a challenge for researchers to understand. Some climatologists like to put a straight line through all the data from 1978 to the present and conclude that the world is continuing to warm, just a little more slowly, but surely if these curves have any connection to reality, changes in slope mean something. Are they evidence of the chaotic nature of climate with abrupt shifts from one state to another?
Essex, McKitrick and Andresen (2007) and Essex and McKitrick (2007) in their popular book have criticized the use of these mean temperature data for the earth. First temperature is an intensive thermodynamic variable relevant to a particular location in equilibrium with the measuring device. Any average with other locations or times of day or seasons has no physical meaning. Other types of averages might be more appropriate such as the second, fourth or inverse power of the absolute temperature, each of which would give a different trend with time. Furthermore it is temperature differences between two places that drive the dynamics. Climatologists have not explained what this single number for global temperature actually means. Essex and McKitrick note that it “is not a temperature. Nor is it even a proper statistic or index. It is a sequence of different statistics grafted together with ad hoc models.”
This questionable use of a global temperature along with the problems of modeling a chaotic system discussed below raise basic concerns about the validity of the test with observations in Section 2. Since climatologists and the IPCC insist on using this temperature number and the models in their predictions of global warming, it still is appropriate to hold them to comparisons with the observations they consider relevant.
6. CHAOS
Essex and McKitrick (2007) have provided a helpful introduction to this problem. Thanks to the pioneering investigations into the equations for convection and the associated turbulence by meteorologist Edward Lorenz, scientists have come to realize that many dynamical systems are fundamentally chaotic. The situation often is described as the butterfly effect because a small change in initial conditions such as the flap of a butterfly wing can have large effects in later results.
Convection and turbulence in the air are central phenomenon in determining weather and so must have their effect on climate too. The IPCC on p. 1-25 of the 2013 Report recognizes this with the statement “There are fundamental limits to just how precisely annual temperatures can be projected, because of the chaotic nature of the climate system.” but then makes predictions with confidence. Meteorologists modeling weather find that their predictions become unstable after a week or two, and they have the advantage of refining their models by comparing predictions with observations.
Why do the climate models in the IPCC reports not show these instabilities? Have they been selectively tuned to avoid them or are the chaotic physical processes not properly included? Why should we think that long-term climate predictions are possible when they are not for weather?
7. THE APPEAL TO CONSENSUS AND THE SILENCING OF SKEPTICISM
Frequently we hear that we must accept that the earth is warming at an alarming rate due to anthropogenic CO2 because 90+% climatologists believe it. However, science is not a consensus discipline. It depends on skeptics questioning every hypothesis, every theory and every model until all rational challenges are satisfied. Any endeavor that must prove itself by appealing to consensus or demeaning skeptics is not science. Why do some proponents of climate alarm dismiss critics by implying they are like Holocaust deniers? Presumably most climatologists disapprove of these unscientific tactics, but too few speak out against them.
8. SUMMARY AND CONCLUSIONS
At least six serious problems confront the climate predictions presented in the last IPCC Report. The models do not predict the observed temperature plateau since 1998, the models adopted a feedback parameter based on the unjustified assumption that the warming prior to 1998 was primarily caused by anthopogenic CO2, the IPCC ignored possible affects of reduced solar activity during the past decade, the temperature anomaly has no physical significance, the models attempt to predict the future of a chaotic system, and there is an appeal to consensus to establish climate science.
Temperatures could start to rise again as we continue to add CO2 to the atmosphere or they could fall as suggested by the present weak solar activity. Many climatologists are trying to address the issues described here to give us a better understanding of the physical processes involved and the reliability of the predictions. One outstanding issue is the location of all the anthropogenic CO2. According to Table 6.1 in the 2013 Report, half goes into the atmosphere and a quarter into the oceans with the remaining quarter assigned to some undefined sequestering as biomass on the land.
Meanwhile what policies should a responsible citizen be advocating? We risk serious consequences from either a major change in climate or an economic recession from efforts to reduce the CO2 output. My personal view is to use this temperature plateau as a time to reassess all the relevant issues. Are there other environmental effects that are equally or more important than global warming? Are some policies like subsidizing biofuels counterproductive? Are large farms of windmills, solar cells or collecting mirrors effective investments when we are unable to store energy? How reliable is the claim that extreme weather events are more frequent because of the global warming? Is it time to admit that we do not understand climate well enough to know how to direct it?
References
DeLand, M. T., & Cebula, R. P. (2012) Solar UV variations during the decline of Cycle 23. J. Atmosph. Solar-Terrestr. Phys., 77, 225.
Essex, C., & McKitrick, R. (2007) Taken by storm: the troubled science, policy and politics of global warming, Key Porter Books. Rev. ed. Toronto, ON, Canada.
Essex, C., McKitrick, R., & Andresen, B. (2007) Does a Global temperature Exist? J. Non-Equilib. Thermodyn. 32, 1.
Haigh. J. D., et al. (2010). An influence of solar spectral variations on radiative forcing of climate. Nature 467, 696.
IPCC (2013), Climate Change 2013: The Physicsal Science Basis. Contribution of Working Group I to the Fifth Assessment Report of the Intergovernmental Panel on Climate Change, http://www.ipcc.ch
Li, L. H., Basu, S., Sofia, S., Robinson, F.J., Demarque, P., & Guenther, D.B. (2003). Global
parameter and helioseismic tests of solar variability models. Astrophys. J., 591, 1284.
Kirkby, J. et al. (2011). Role of sulphuric acid, ammonia and galactic cosmic rays in atmospheric
aerosol nucleation. Nature, 476, 429.
Knight, J., et al. (2009). Bull. Amer. Meteor. Soc., 90 (8), Special Suppl. pp. S22, S23.
Morton, D. C. (2014). An Astronomer’s view of Climate Change. J. Roy. Astron. Soc. Canada, 108, 27. http://arXiv.org/abs/1401.8235.
Svensmark, H., Enghoff, M.B., & Pedersen, J.O.P. (2013). Response of cloud condensation nuclei (> 50 nm) to changes in ion-nucleation. Phys. Lett. A, 377, 2343.
Tapping, K.F. (2013). The 10.7 cm radio flux (F10.7). Space Weather, 11, 394.
Related articles


How Statins Really Work Explains Why They Don’t Really Work
By Stephanie Seneff | March 11, 2011
Introduction
The statin industry has enjoyed a thirty year run of steadily increasing profits, as they find ever more ways to justify expanding the definition of the segment of the population that qualify for statin therapy. Large, placebo-controlled studies have provided evidence that statins can substantially reduce the incidence of heart attack. High serum cholesterol is indeed correlated with heart disease, and statins, by interfering with the body’s ability to synthesize cholesterol, are extremely effective in lowering the numbers. Heart disease is the number one cause of death in the U.S. and, increasingly, worldwide. What’s not to like about statin drugs?
I predict that the statin drug run is about to end, and it will be a hard landing. The thalidomide disaster of the 1950’s and the hormone replacement therapy fiasco of the 1990’s will pale by comparison to the dramatic rise and fall of the statin industry. I can see the tide slowly turning, and I believe it will eventually crescendo into a tidal wave, but misinformation is remarkably persistent, so it may take years.
I have spent much of my time in the last few years combing the research literature on metabolism, diabetes, heart disease, Alzheimer’s, and statin drugs. Thus far, in addition to posting essays on the web, I have, together with collaborators, published two journal articles related to metabolism, diabetes, and heart disease (Seneff1 et al., 2011), and Alzheimer’s disease (Seneff2 et al., 2011). Two more articles, concerning a crucial role for cholesterol sulfate in metabolism, are currently under review (Seneff3 et al., Seneff4 et al.). I have been driven by the need to understand how a drug that interferes with the synthesis of cholesterol, a nutrient that is essential to human life, could possibly have a positive impact on health. I have finally been rewarded with an explanation for an apparent positive benefit of statins that I can believe, but one that soundly refutes the idea that statins are protective. I will, in fact, make the bold claim that nobody qualifies for statin therapy, and that statin drugs can best be described as toxins.
Cholesterol and Statins
I would like to start by reexamining the claim that statins cut heart attack incidence by a third. What exactly does this mean? A meta study reviewing seven drug trials, involving in total 42,848 patients, ranging over a three to five year period, showed a 29% decreased risk of a major cardiac event (Thavendiranathan et al., 2006). But because heart attacks were rare among this group, what this translates to in absolute terms is that 60 patients would need to be treated for an average of 4.3 years to protect one of them from a single heart attack. However, essentially all of them will experience increased frailty and mental decline, a subject to which I will return in depth later on in this essay.
The impact of the damage due to the statin anti-cholesterol mythology extends far beyond those who actually consume the statin pills. Cholesterol has been demonized by the statin industry, and as a consequence Americans have become conditioned to avoid all foods containing cholesterol. This is a grave mistake, as it places a much bigger burden on the body to synthesize sufficient cholesterol to support the body’s needs, and it deprives us of several essential nutrients. I am pained to watch someone crack open an egg and toss out the yolk because it contains “too much” cholesterol. Eggs are a very healthy food, but the yolk contains all the important nutrients. After all, the yolk is what allows the chick embryo to mature into a chicken. Americans are currently experiencing widespread deficiencies in several crucial nutrients that are abundant in foods that contain cholesterol, such as choline, zinc, niacin, vitamin A and vitamin D.
Cholesterol is a remarkable substance, without which all of us would die. There are three distinguishing factors which give animals an advantage over plants: a nervous system, mobility, and cholesterol. Cholesterol, absent from plants, is the key molecule that allows animals to have mobility and a nervous system. Cholesterol has unique chemical properties that are exploited in the lipid bilayers that surround all animal cells: as cholesterol concentrations are increased, membrane fluidity is decreased, up to a certain critical concentration, after which cholesterol starts to increase fluidity (Haines, 2001). Animal cells exploit this property to great advantage in orchestrating ion transport, which is essential for both mobility and nerve signal transport. Animal cell membranes are populated with a large number of specialized island regions appropriately called lipid rafts. Cholesterol gathers in high concentrations in lipid rafts, allowing ions to flow freely through these confined regions. Cholesterol serves a crucial role in the non-lipid raft regions as well, by preventing small charged ions, predominantly sodium (Na+) and potassium (K+), from leaking across cell membranes. In the absence of cholesterol, cells would have to expend a great deal more energy pulling these leaked ions back across the membrane against a concentration gradient.
In addition to this essential role in ion transport, cholesterol is the precursor to vitamin D3, the sex hormones, estrogen, progesterone, and testosterone, and the steroid hormones such as cortisol. Cholesterol is absolutely essential to the cell membranes of all of our cells, where it protects the cell not only from ion leaks but also from oxidation damage to membrane fats. While the brain contains only 2% of the body’s weight, it houses 25% of the body’s cholesterol. Cholesterol is vital to the brain for nerve signal transport at synapses and through the long axons that communicate from one side of the brain to the other. Cholesterol sulfate plays an important role in the metabolism of fats via bile acids, as well as in immune defenses against invasion by pathogenic organisms.
Statin drugs inhibit the action of an enzyme, HMG coenzyme A reductase, that catalyses an early step in the 25-step process that produces cholesterol. This step is also an early step in the synthesis of a number of other powerful biological substances that are involved in cellular regulation processes and antioxidant effects. One of these is coenzyme Q10, present in the greatest concentration in the heart, which plays an important role in mitochondrial energy production and acts as a potent antioxidant (Gottlieb et al., 2000). Statins also interfere with cell-signaling mechanisms mediated by so-called G-proteins, which orchestrate complex metabolic responses to stressed conditions. Another crucial substance whose synthesis is blocked is dolichol, which plays a crucial role in the endoplasmic reticulum. We can’t begin to imagine what diverse effects all of this disruption, due to interference with HMG coenzyme A reductase, might have on the cell’s ability to function.
LDL, HDL, and Fructose
We have been trained by our physicians to worry about elevated serum levels of low density lipoprotein (LDL), with respect to heart disease. LDL is not a type of cholesterol, but rather can be viewed as a container that transports fats, cholesterol, vitamin D, and fat-soluble anti-oxidants to all the tissues of the body. Because they are not water-soluble, these nutrients must be packaged up and transported inside LDL particles in the blood stream. If you interfere with the production of LDL, you will reduce the bioavailability of all these nutrients to your body’s cells.
The outer shell of an LDL particle is made up mainly of lipoproteins and cholesterol. The lipoproteins contain proteins on the outside of the shell and lipids (fats) in the interior layer. If the outer shell is deficient in cholesterol, the fats in the lipoproteins become more vulnerable to attack by oxygen, ever-present in the blood stream. LDL particles also contain a special protein called “apoB” which enables LDL to deliver its goods to cells in need. ApoB is vulnerable to attack by glucose and other blood sugars, especially fructose. Diabetes results in an increased concentration of sugar in the blood, which further compromises the LDL particles, by gumming up apoB. Oxidized and glycated LDL particles become less efficient in delivering their contents to the cells. Thus, they stick around longer in the bloodstream, and the measured serum LDL level goes up.
Worse than that, once LDL particles have finally delivered their contents, they become “small dense LDL particles,” remnants that would ordinarily be returned to the liver to be broken down and recycled. But the attached sugars interfere with this process as well, so the task of breaking them down is assumed instead by macrophages in the artery wall and elsewhere in the body, through a unique scavenger operation. The macrophages are especially skilled to extract cholesterol from damaged LDL particles and insert it into HDL particles. Small dense LDL particles become trapped in the artery wall so that the macrophages can salvage and recycle their contents, and this is the basic source of atherosclerosis. HDL particles are the so-called “good cholesterol,” and the amount of cholesterol in HDL particles is the lipid metric with the strongest correlation with heart disease, where less cholesterol is associated with increased risk. So the macrophages in the plaque are actually performing a very useful role in increasing the amount of HDL cholesterol and reducing the amount of small dense LDL.
The LDL particles are produced by the liver, which synthesizes cholesterol to insert into their shells, as well as into their contents. The liver is also responsible for breaking down fructose and converting it into fat (Collison et al., 2009). Fructose is ten times more active than glucose at glycating proteins, and is therefore very dangerous in the blood serum (Seneff1 et al., 2011). When you eat a lot of fructose (such as the high fructose corn syrup present in lots of processed foods and carbonated beverages), the liver is burdened with getting the fructose out of the blood and converting it to fat, and it therefore can not keep up with cholesterol supply. As I said before, the fats can not be safely transported if there is not enough cholesterol. The liver has to ship out all that fat produced from the fructose, so it produces low quality LDL particles, containing insufficient protective cholesterol. So you end up with a really bad situation where the LDL particles are especially vulnerable to attack, and attacking sugars are readily available to do their damage.
How Statins Destroy Muscles
Europe, especially the U.K., has become much enamored of statins in recent years. The U.K. now has the dubious distinction of being the only country where statins can be purchased over-the-counter, and the amount of statin consumption there has increased more than 120% in recent years (Walley et al, 2005). Increasingly, orthopedic clinics are seeing patients whose problems turn out to be solvable by simply terminating statin therapy, as evidenced by a recent report of three cases within a single year in one clinic, all of whom had normal creatine kinase levels, the usual indicator of muscle damage monitored with statin usage, and all of whom were “cured” by simply stopping statin therapy (Shyam Kumar et al., 2008). In fact, creatine kinase monitoring is not sufficient to assure that statins are not damaging your muscles (Phillips et al., 2002).
Since the liver synthesizes much of the cholesterol supply to the cells, statin therapy greatly impacts the liver, resulting in a sharp reduction in the amount of cholesterol it can synthesize. A direct consequence is that the liver is severely impaired in its ability to convert fructose to fat, because it has no way to safely package up the fat for transport without cholesterol (Vila et al., 2011). Fructose builds up in the blood stream, causing lots of damage to serum proteins.
The skeletal muscle cells are severely affected by statin therapy. Four complications they now face are: (1) their mitochondria are inefficient due to insufficient coenzyme Q10, (2) their cell walls are more vulnerable to oxidation and glycation damage due to increased fructose concentrations in the blood, reduced choleserol in their membranes, and reduced antioxidant supply, (3) there’s a reduced supply of fats as fuel because of the reduction in LDL particles, and (4) crucial ions like sodium and potassium are leaking across their membranes, reducing their charge gradient. Furthermore, glucose entry, mediated by insulin, is constrained to take place at those lipid rafts that are concentrated in cholesterol. Because of the depleted cholesterol supply, there are fewer lipid rafts, and this interferes with glucose uptake. Glucose and fats are the main sources of energy for muscles, and both are compromised.
As I mentioned earlier, statins interfere with the synthesis of coenzyme Q10 (Langsjoen and Langsjoen, 2003), which is highly concentrated in the heart as well as the skeletal muscles, and, in fact, in all cells that have a high metabolic rate. It plays an essential role in the citric acid cycle in mitochondria, responsible for the supply of much of the cell’s energy needs. Carbohydrates and fats are broken down in the presence of oxygen to produce water and carbon dioxide as by-products. The energy currency produced is adenosine triphosphate (ATP), and it becomes severely depleted in the muscle cells as a consequence of the reduced supply of coenzyme Q10.
The muscle cells have a potential way out, using an alternative fuel source, which doesn’t involve the mitochondria, doesn’t require oxygen, and doesn’t require insulin. What it requires is an abundance of fructose in the blood, and fortunately (or unfortunately, depending on your point of view) the liver’s statin-induced impairment results in an abundance of serum fructose. Through an anaerobic process taking place in the cytoplasm, specialized muscle fibers skim off just a bit of the energy available from fructose, and produce lactate as a product, releasing it back into the blood stream. They have to process a huge amount of fructose to produce enough energy for their own use. Indeed, statin therapy has been shown to increase the production of lactate by skeletal muscles (Pinieux et al, 1996).
Converting one fructose molecule to lactate yields only two ATP’s, whereas processing a sugar molecule all the way to carbon dioxide and water in the mitochondria yields 38 ATP’s. In other words, you need 19 times as much substrate to obtain an equivalent amount of energy. The lactate that builds up in the blood stream is a boon to both the heart and the liver, because they can use it as a substitute fuel source, a much safer option than glucose or fructose. Lactate is actually an extremely healthy fuel, water-soluble like a sugar but not a glycating agent.
So the burden of processing excess fructose is shifted from the liver to the muscle cells, and the heart is supplied with plenty of lactate, a high-quality fuel that does not lead to destructive glycation damage. LDL levels fall, because the liver can’t keep up with fructose removal, but the supply of lactate, a fuel that can travel freely in the blood (does not have to be packaged up inside LDL particles) saves the day for the heart, which would otherwise feast off of the fats provided by the LDL particles. I think this is the crucial effect of statin therapy that leads to a reduction in heart attack risk: the heart is well supplied with a healthy alternative fuel.
This is all well and good, except that the muscle cells get wrecked in the process. Their cell walls are depleted in cholesterol because cholesterol is in such short supply, and their delicate fats are therefore vulnerable to oxidation damage. This problem is further compounded by the reduction in coenzyme Q10, a potent antioxidant. The muscle cells are energy starved, due to dysfunctional mitochondria, and they try to compensate by processing an excessive amount of both fructose and glucose anaerobically, which causes extensive glycation damage to their crucial proteins. Their membranes are leaking ions, which interferes with their ability to contract, hindering movement. They are essentially heroic sacrificial lambs, willing to die in order to safeguard the heart.
Muscle pain and weakness are widely acknowledged, even by the statin industry, as potential side effects of statin drugs. Together with a couple of MIT students, I have been conducting a study which shows just how devastating statins can be to muscles and the nerves that supply them (Liu et al, 2011). We gathered over 8400 on-line drug reviews prepared by patients on statin therapy, and compared them to an equivalent number of reviews for a broad spectrum of other drugs. The reviews for comparison were selected such that the age distribution of the reviewers was matched against that for the statin reviews. We used a measure which computes how likely it would be for the words/phrases that show up in the two sets of reviews to be distributed in the way they are observed to be distributed, if both sets came from the same probability model. For example, if a given side effect showed up a hundred times in one data set and only once in the other, this would be compelling evidence that this side effect was representative of that data set. Table 1 shows several conditions associated with muscle problems that were highly skewed towards the statin reviews.
Side Effect # Statin Reviews # Non-Statin Reviews Associated P-value Muscle Cramps 678 193 0.00005 General Weakness 687 210 0.00006 Muscle Weakness 302 45 0.00023 Difficulty Walking 419 128 0.00044 Loss of Muscle Mass 54 5 0.01323 Numbness 293 166 0.01552 Muscle Spasms 136 57 0.01849 Table 1: Counts of the number of reviews where phrases associated with various symptoms related to muscles appeared, for 8400 statin and 8400 non-statin drug reviews, along with the associated p-value, indicating the likelihood that this distribution could have occurred by chance.
I believe that the real reason why statins protect the heart from a heart attack is that muscle cells are willing to make an incredible sacrifice for the sake of the larger good. It is well acknowledged that exercise is good for the heart, although people with a heart condition have to watch out for overdoing it, walking a careful line between working out the muscles and overtaxing their weakened heart. I believe, in fact, that the reason exercise is good is exactly the same as the reason statins are good: it supplies the heart with lactate, a very healthy fuel that does not glycate cell proteins.
Membrane Cholesterol Depletion and Ion Transport
As I alluded to earlier, statin drugs interfere with the ability of muscles to contract through the depletion of membrane cholesterol. (Haines, 2001) has argued that the most important role of cholesterol in cell membranes is the inhibition of leaks of small ions, most notably sodium (Na+) and potassium (K+). These two ions are essential for movements, and indeed, cholesterol, which is absent in plants, is the key molecule that permits mobility in animals, through its strong control over ion leakage of these molecules across cell walls. By protecting the cell from ion leaks, cholesterol greatly reduces the amount of energy the cell needs to invest in keeping the ions on the right side of the membrane.
There is a widespread misconception that “lactic acidosis,” a condition that can arise when muscles are worked to exahustion, is due to lactic acid synthesis. The actual story is the exact opposite: the acid build-up is due to excess breakdown of ATP to ADP to produce energy to support muscle contraction. When the mitochondria can’t keep up with energy consumption by renewing the ATP, the production of lactate becomes absolutely necessary to prevent acidosis (Robergs et al., 2004). In the case of statin therapy, excessive leaks due to insufficient membrane cholesterol require more energy to correct, and all the while the mitochondria are producing less energy.
In in vitro studies of phospholipid membranes, it has been shown that the removal of cholesterol from the membrane leads to a nineteen fold increase in the rate of potassium leaks through the membrane (Haines, 2001). Sodium is affected to a lesser degree, but still by a factor of three. Through ATP-gated potassium and sodium channels, cells maintain a strong disequilibrium across their cell wall for these two ions, with sodium being kept out and potassium being held inside. This ion gradient is what energizes muscle movement. When the membrane is depleted in cholesterol, the cell has to burn up substantially more ATP to fight against the steady leakage of both ions. With cholesterol depletion due to statins, this is energy it doesn’t have, because the mitochondria are impaired in energy generation due to coenzyme-Q10 depletion.
Muscle contraction itself causes potassium loss, which further compounds the leak problem introduced by the statins, and the potassium loss due to contraction contributes significantly to muscle fatigue. Of course, muscles with insufficient cholesterol in their membranes lose potassium even faster. Statins make the muscles much more vulnerable to acidosis, both because their mitochondria are dysfunctional and because of an increase in ion leaks across their membranes. This is likely why athletes are more susceptible to muscle damage from statins (Meador and Huey, 2010, Sinzinger and O’Grady, 2004): their muscles are doubly challenged by both the statin drug and the exercise.
An experiment with rat soleus muscles in vitro showed that lactate added to the medium was able to almost fully recover the force lost due to potassium loss (Nielsen et al, 2001). Thus, production and release of lactate becomes essential when potassium is lost to the medium. The loss of strength in muscles supporting joints can lead to sudden uncoordinated movements, overstressing the joints and causing arthritis (Brandt et al., 2009). In fact, our studies on statin side effects revealed a very strong correlation with arthritis, as shown in the table.
While I am unaware of a study involving muscle cell ion leaks and statins, a study on red blood cells and platelets has shown that there is a substantial increase in the Na+-K+-pump activity after just a month on a modest 10 mg/dl statin dosage, with a concurrent decrease in the amount of cholesterol in the membranes of these cells (Lohn et al., 2000). This increased pump activity (necessitated by membrane leaks) would require additional ATP and thus consume extra energy.
Muscle fibers are characterized along a spectrum by the degree to which they utilize aerobic vs anaerobic metabolism. The muscle fibers that are most strongly damaged by statins are the ones that specialize in anaerobic metabolism (Westwood et al., 2005). These fibers (Type IIb) have very few mitochondria, as contrasted with the abundant supply of mitochondria in the fully aerobic Type 1A fibers. I suspect their vulnerability is due to the fact that they carry a much larger burden of generating ATP to fuel the muscle contraction and to produce an abundance of lactate, a product of anaerobic metabolism. They are tasked with both energizing not only themselves but also the defective aerobic fibers (due to mitochondrial dysfunction) and producing enough lactate to offset the acidosis developing as a consequence of widespread ATP shortages.
Long-term Statin Therapy Leads to Damage Everywhere
Statins, then, slowly erode the muscle cells over time. After several years have passed, the muscles reach a point where they can no longer keep up with essentially running a marathon day in and day out. The muscles start literally falling apart, and the debris ends up in the kidney, where it can lead to the rare disorder, rhabdomyolysis, which is often fatal. In fact, 31 of our statin reviews contained references to “rhabdomyolysis” as opposed to none in the comparison set. Kidney failure, a frequent consequence of rhabdomyolysis, showed up 26 times among the statin reviews, as opposed to only four times in the control set.
The dying muscles ultimately expose the nerves that innervate them to toxic substances, which then leads to nerve damage such as neuropathy, and, ultimately Amyotrophic Lateral Sclerosis (ALS), also known as Lou Gehrig’s disease, a very rare, debilitating, and ultimately fatal disease which is now on the rise due (I believe) to statin drugs. People diagnosed with ALS rarely live beyond five years. Seventy-seven of our statin reviews contained references to ALS, as against only 7 in the comparison set.
As ion leaks become untenable, cells will begin to replace the potassium/sodium system with a calcium/magnesium based system. These two ions are in the same rows of the periodic table as sodium/potassium, but advanced by one column, which means that they are substantially larger, and therefore it’s much harder for them to accidentally leak out. But this results in extensive calcification of artery walls, heart valves, and the heart muscle itself. Calcified heart valves can no longer function properly to prevent backflow, and diastolic heart failure results from increased left ventricular stiffness. Research has shown that statin therapy leads to increased risk to diastolic heart failure (Silver et al., 2004, Weant and Smith, 2005). Heart failure shows up 36 times in our statin drug data as against only 8 times in the comparison group.
Once the muscles can no longer keep up with lactate supply, the liver and heart will be further imperilled. They’re now worse off than they were before statins, because the lactate is no longer available, and the LDL, which would have provided fats as a fuel source, is greatly reduced. So they’re stuck processing sugar as fuel, something that is now much more perilous than it used to be, because they are depleted in membrane cholesterol. Glucose entry into muscle cells, including the heart muscle, mediated by insulin, is orchestrated to occur at lipid rafts, where cholesterol is highly concentrated. Less membrane cholesterol results in fewer lipid rafts, and this leads to impaired glucose uptake. Indeed, it has been proposed that statins increase the risk to diabetes (Goldstein and Mascitelli, 2010, Hagedorn and Arora, 2010). Our data bear out this notion, with the probability of the observed distributions of diabetes references happening by chance being only 0.006.
Side Effect # Statin Reviews # Non-Statin Reviews Associated P-value Rhabdomyolysis 31 0 0.02177 Liver Damage 326 133 0.00285 Diabetes 185 62 0.00565 ALS 71 7 0.00819 Heart Failure 36 8 0.04473 Kidney Failure 26 4 0.05145 Arthritis 245 120 0.01117 Memory Problems 545 353 0.01118 Parkinson’s Disease 53 3 0.01135 Neuropathy 133 73 0.04333 Dementia 41 13 0.05598 Table 2: Counts of the number of reviews where phrases associated with various symptoms related to major health issues appeared, besides muscle problems, for 8400 statin and 8400 non-statin drug reviews, along with the associated p-value, indicating the likelihood that this distribution could have occurred by chance.
Statins, Caveolin, and Muscular Dystrophy
Lipid rafts are crucial centers for transport of substances (both nutrients and ions) across cell membranes and as a cell signaling domain in essentially all mammalian cells. Caveolae (“little caves”) are microdomains within lipid rafts, which are enriched in a substance called caveolin (Gratton et al., 2004). Caveolin has received increasing attention of late due to the widespread role it plays in cell signaling mechanisms and the transport of materials between the cell and the environment (Smart et al., 1999).
Statins are known to interfere with caveolin production, both in endothelial cells (Feron et al., 2001) and in heart muscle cells, where they’ve been shown to reduce the density of caveolae by 30% (Calaghan, 2010). People who have a defective form of caveolin-3, the version of caveolin that is present in heart and skeletal muscle cells, develop muscular dystrophy as a consequence (Minetti et al., 1998). Mice engineered to have defective caveolin-3 that stayed in the cytoplasm instead of binding to the cell wall at lipid rafts exhibited stunted growth and paralysis of their legs (Sunada et al., 2001). Caveolin is crucial to cardiac ion channel function, which, in turn, is essential in regulating the heart beat and protecting the heart from arrhythmias and cardiac arrest (Maguy et al, 2006). In arterial smooth muscle cells, caveolin is essential to the generation of calcium sparks and waves, which, in turn, are essential for arterial contraction and expansion, to pump blood through the body (Taggart et al, 2010).
In experiments involving constricting the arterial blood supply to rats’ hearts, researchers demonstrated a 34% increase in the amount of caveolin-3 produced by the rat’s hearts, along with a 27% increase in the weight of the left ventricle, indicating ventricular hypertrophy. What this implies is that the heart needs additional caveolin to cope with blocked vessels, whereas statins interfere with the ability to produce extra caveolin (Kikuchi et al., 2005).
Statins and the Brain
While the brain is not the focus of this essay, I cannot resist mentioning the importance of cholesterol to the brain and the evidence of mental impairment available from our data sets. Statins would be expected to have a negative impact on the brain, because, while the brain makes up only 2% of the body’s weight, it houses 25% of the body’s cholesterol. Cholesterol is highly concentrated in the myelin sheath, which encloses axons which transport messages long distances (Saher et al., 2005). Cholesterol also plays a crucial role in the transmission of neurotransmitters across the synapse (Tong et al, 2009). We found highly skewed distribution of word frequencies for dementia, Parkinson’s disease, and short term memory loss, with all of these occurring much more frequently in the statin reviews than in the comparison reviews.
A recent evidence-based article (Cable, 2009) found that statin drug users had a high incidence of neurological disorders, especially neuropathy, parasthesia and neuralgia, and appeared to be at higher risk to the debilitating neurological diseases, ALS and Parkinson’s disease. The evidence was based on careful manual labeling of a set of self-reported accounts from 351 patients. A mechanism for such damage could involve interference with the ability of oligodendrocytes, specialized glial cells in the nervous system, to supply sufficient cholesterol to the myelin sheath surrounding nerve axons. Genetically-engineered mice with defective oligodendrocytes exhibit visible pathologies in the myelin sheath which manifest as muscle twitches and tremors (Saher et al, 2005). Cognitive impairment, memory loss, mental confusion, and depression were also significantly present in Cable’s patient population. Thus, his analysis of 351 adverse drug reports was largely consistent with our analysis of 8400 reports.
Cholesterol’s Benefits to Longevity
The broad spectrum of severe disabilities with increased prevalence in statin side effect reviews all point toward a general trend of increased frailty and mental decline with long-term statin therapy, things that are usually associated with old age. I would in fact best characterize statin therapy as a mechanism to allow you to grow old faster. A highly enlightening study involved a population of elderly people who were monitored over a 17 year period, beginning in 1990 (Tilvis et al., 2011). The investigators looked at an association between three different measures of cholesterol and manifestations of decline. They measured indicators associated with physical frailty and mental decline, and also looked at overall longevity. In addition to serum cholesterol, a biometric associated with the ability to synthesize cholesterol (lathosterol) and a biometric associated with the ability to absorb cholesterol through the gut (sitosterol) were measured.
Low values of all three measures of cholesterol were associated with a poorer prognosis for frailty, mental decline and early death. A reduced ability to synthesize cholesterol showed the strongest correlation with poor outcome. Individuals with high measures of all three biometrics enjoyed a 4.3 year extension in life span, compared to those for whom all measures were low. Since statins specifically interfere with the ability to synthesize cholesterol, it is logical that they would also lead to increased frailty, accelerated mental decline, and early death.
For both ALS and heart failure, survival benefit is associated with elevated cholesterol levels. A statistically significant inverse correlation was found in a study on mortality in heart failure. For 181 patients with heart disease and heart failure, half of those whose serum cholesterol was below 200 mg/dl were dead three years after diagnosis, whereas only 28% of the patients whose serum cholesterol was above 200 mg/dl had died. In another study on a group of 488 patients diagnosed with ALS, serum levels of triglycerides and fasting cholesterol were measured at the time of diagnosis (Dorstand et al., 2010). High values for both lipids were associated with improved survival, with a p-value < 0.05.
What to do Instead to Avoid Heart Disease
If statins don’t work in the long run, then what can you do to protect your heart from atherosclerosis? My personal opinion is that you need to focus on natural ways to reduce the number of small dense LDL particles, which feed the plaque, and alternative ways to supply the product that the plaque produces (more about that in a moment). Obviously, you need to cut way back on fructose intake, and this means mainly eating whole foods instead of processed foods. With less fructose, the liver won’t have to produce as many LDL particles from the supply side. From the demand side, you can reduce your body’s dependency on both glucose and fat as fuel by simply eating foods that are good sources of lactate. Sour cream and yogurt contain lots of lactate, and milk products in general contain the precursor lactose, which gut bacteria will convert to lactate, assuming you don’t have lactose intolerance. Strenuous physical exercise, such as a tread machine workout, will help to get rid of any excess fructose and glucose in the blood, with the skeletal muscles converting them to the much coveted lactate.
Finally, I have a set of perhaps surprising recommendations that are based on research I have done leading to the two papers that are currently under review (Seneff3 et al, Seneff4 et al.). My research has uncovered compelling evidence that the nutrient that is most crucially needed to protect the heart from atherosclerosis is cholesterol sulfate. The extensive literature review my colleagues and I have conducted to produce these two papers shows compellingly that the fatty deposits that build-up in the artery walls leading to the heart exist mainly for the purpose of extracting cholesterol from glycated small dense LDL particles and synthesizing cholesterol sulfate from it, providing the cholesterol sulfate directly to the heart muscle. The reason the plaque build-up occurs preferentially in the arteries leading to the heart is so that the heart muscle can be assured an adequate supply of cholesterol sulfate. In our papers, we develop the argument that the cholesterol sulfate plays an essential role in the caveolae in the lipid rafts, in mediating oxygen and glucose transport.
The skin produces cholesterol sulfate in large quantities when it is exposed to sunlight. Our theory suggests that the skin actually synthesizes sulfate from sulfide, capturing energy from sunlight in the form of the sulfate molecule, thus acting as a solar-powered battery. The sulfate is then shipped to all the cells of the body, carried on the back of the cholesterol molecule.
Evidence of the benefits of sun exposure to the heart is compelling, as evidenced by a study conducted to investigate the relationship between geography and cardiovascular disease (Grimes et al., 1996). Through population statistics, the study showed a consistent and striking inverse linear relationship between cardiovascular deaths and estimated sunlight exposure, taking into account percentage of sunny days as well as latitude and altitude effects. For instance, the cardiovascular-related death rate for men between the ages of 55 and 64 was 761 in Belfast, Ireland but only 175 in Toulouse, France.
Cholesterol sulfate is very versatile. It is water soluble so it can travel freely in the blood stream, and it enters cell membranes ten times as readily as cholesterol, so it can easily resupply cholesterol to cells. The skeletal and heart muscle cells make good use of the sulfate as well, converting it back to sulfide, and synthesizing ATP in the process, thus recovering the energy from sunlight. This decreases the burden on the mitochondria to produce energy. The oxygen released from the sulfate molecule is a safe source of oxygen for the citric oxide cycle in the mitochondria.
So, in my view, the best way to avoid heart disease is to assure an abundance of an alternative supply of cholesterol sulfate. First of all, this means eating foods that are rich in both cholesterol and sulfur. Eggs are an optimal food, as they are well supplied with both of these nutrients. But secondly, this means making sure you get plenty of sun exposure to the skin. This idea flies in the face of the advice from medical experts in the United States to avoid the sun for fear of skin cancer. I believe that the excessive use of sunscreen has contributed significantly, along with excess fructose consumption, to the current epidemic in heart disease. And the natural tan that develops upon sun exposure offers far better protection from skin cancer than the chemicals in sunscreens.
Concluding Remarks
Every individual gets at most only one chance to grow old. When you experience your body falling apart, it is easy to imagine that this is just due to the fact that you are advancing in age. I think the best way to characterize statin therapy is that it makes you grow older faster. Mobility is a great miracle that cholesterol has enabled in all animals. By suppressing cholesterol synthesis, statin drugs can destroy that mobility. No study has shown that statins improve all-cause mortality statistics. But there can be no doubt that statins will make your remaining days on earth a lot less pleasant than they would otherwise be.
To optimize the quality of your life, increase your life expectancy, and avoid heart disease, my advice is simple: spend significant time outdoors; eat healthy, cholesterol-enriched, animal-based foods like eggs, liver, and oysters; eat fermented foods like yogurt and sour cream; eat foods rich in sulfur like onions and garlic. And finally, say “no, thank-you” to your doctor when he recommends statin therapy.
References
[1] K.D. Brandt, P. Dieppe, E. Radin, “Etiopathogenesis of osteoarthritis”. Med. Clin. North Am. 93 (1): 1–24, 2009.
[2] J. Cable, “Adverse Events of Statins – An Informal Internet-based Study,” JOIMR, 7(1), 2009. [3] S. Calaghan, “Caveolae as key regulators of cardiac myocyte beta2 adrenoceptor signalling: a novel target for statins” Research Symposium on Caveolae: Essential Signalosomes for the Cardiovascular System, Proc Physiol Soc 19, SA21, University of Manchester, 2010.
[4] K.S. Collison, S.M. Saleh, R.H. Bakheet, R.K. Al-Rabiah, A.L. Inglis, N.J. Makhoul, Z.M. Maqbool, M. Zia Zaidi, M.A. Al-Johi and F.A. Al-Mohanna, “Diabetes of the Liver: The Link Between Nonalcoholic Fatty Liver Disease and HFCS-55” Obesity, 17(11), 2003-2013, Nov. 2009.
[5] J. Dorstand, P. Ku ̈hnlein, C. Hendrich, J. Kassubek, A.D. Sperfeld, and A.C. Ludolph. “Patients with elevated triglyceride and cholesterol serum levels have a prolonged survival in amyotrophic lateral sclerosis,” J Neurol. in Press:Published online Dec. 3 2010.
[6] O. Feron, C. Dessy, J.-P. Desager, andJ.-L. Balligand, “Hydroxy-Metholglutaryl-Coenzyme A Reductase Inhibition Promotes Endothelial Nitric Oxide Synthase Activation Through a Decrease in Caveolin Abundance,” Circulation 103, 113-118, 2001.
[7] M.R. Goldstein and L. Mascitelli, “Statin-induced diabetes: perhaps, its the tip of the iceberg,” QJM, Published online, Nov 30, 2010.
[8] S.S. Gottlieb, M. Khatta, and M.L. Fisher. “Coenzyme Q10 and congestive heart failure.” Ann Intern Med, 133(9):745–6, 2000.
[9] J.-P. Gratton, P. Bernatchez, and W.C. Sessa, “Caveolae and Caveolins in the Cardiovascular System,” Circulation Research, 94:1408-1417, June 11, 2004.
[10] D.S. Grimes, E. Hindle and T. Dyer, “Sunlight, Cholesterol and Coronary Heart Disease,” Q. J. Med 89, 579-589, 1996; http://www.ncbi.nlm.nih.gov/pubmed/8935479
[11] J. Hagedorn and R. Arora, “Association of Statins and Diabetes Mellitus,” American Journal of Therapeutics, 17(2):e52, 2010.
[12] T.H. Haines, “Do Sterols Reduce Proton and Sodium Leaks through Lipid Bilayers?” Progress in Lipid Research, 40, 299-324., 2001; http://www.ncbi.nlm.nih.gov/pubmed/11412894
[13] T. Kikuchi, N. Oka, A. Koga, H. Miyazaki, H. Ohmura, and T. Imaizumi, “Behavior of Caveolae and Caveolin-3 During the Development of Myocyte Hypertrophy,” J Cardiovasc Pharmacol. 45:3, 204-210, March 2005.
[14] P.H. Langsjoen and A.M. Langsjoen, “The clinical use of HMG CoA-reductase inhibitors and the associated depletion of coenzyme Q10. A review of animal and human publications.” Biofactors, 18(1):101–111, 2003.
[15] J. Liu, A. Li and S. Seneff, “Automatic Drug Side Effect Discovery from Online Patient-Submitted Reviews: Focus on Statin Drugs.” Submitted to First International Conference on Advances in Information Mining and Management (IMMM) Jul 17-22, 2011, Bournemouth, UK.
[16] M. Löhn, M. Fürstenau, V. Sagach, M. Elger, W. Schulze, F.C. Luft, H. Haller, and M. Gollasch, “Ignition of Calcium Sparks in Arterial and Cardiac Muscle Through Caveolae,” Circ. Res. 2000;87;1034-1039
[17] A. Maguy, T.E. Hebert, and S. Nattel, “Involvement of Lipid rafts and Caveolae in cardiac ion channel function,” Cardiovascular Research, 69, 798-807, 2006.
[18] B.M. Meador and K.A. Huey, “Statin-Associated Myopathy and its Exacerbation with Exercise,” Muscle and Nerve, 469-79, Oct. 2010.
[19] C. Minetti, F. Sotgia, C. Bruno, et al., “Mutations in the caveolin-3 gene cause autosomal dominant limb-girdle muscular dystrophy,” Nat. Genet., 18, 365-368, 1998.
[20] O.B. Nielsen, F. de Paoli, and K. Overgaard, “Protective effects of lactic acid on force production in rat skeletal muscles.” J. Phhsiology 536(1), 161-166, 2001.
[21] P.S. Phillips, R.H. Haas, S. Bannykh, S. Hathaway, N.L. Gray, B.J. Kimura, G. D. Vladutiu, and J.D.F. England. “Statin-associated myopathy with normal creatine kinase levels,” Ann Intern Med, October 1, 2002;137:581–5.
[22] G. de Pinieux, P. Chariot, M. Ammi-Said, F. Louarn, J.L. LeJonc, A. Astier, B. Jacotot, and R. Gherardi, “Lipid-lowering drugs and mitochondrial function: effects of HMG-CoA reducase inhibitors on serum ubiquinone and blood lactate/pyruvate ratios.” Br. J. Clin. Pharmacol. 42: 333-337, 1996.
[23] R.A. Robergs, F. Ghiasvand, and D. Parker, “Biochemistry of exercise-induced metabolic acidosis.” Am J Physiol Regul Integr Comp Physiol 287: R502–R516, 2004.
[24] G. Saher, B. Brügger, C. Lappe-Siefke, et al. “High cholesterol level is essential for myelin membrane growth.” Nat Neurosci 8:468-75, 2005.
[25] S. Seneff, G. Wainwright, and L. Mascitelli, “Is the Metabolic Syndrome Caused by a High Fructose, and Relatively Low Fat, Low Cholesterol Diet?” Archives of Medical Science, 7(1), 8-20, 2011; DOI: 10.5114/aoms.2011.20598
[26] S. Seneff, G. Wainwright, and L. Mascitelli, “Nutrition and Alzheimer’s Disease: the Detrimental Role of a High Carbohydrate Diet,” In Press, European Journal of Internal Medicine, 2011.
[27] S. Seneff, G. Wainwright and B. Hammarskjold, “Cholesterol Sulfate Supports Glucose and Oxygen Transport into Erythrocytes and Myocytes: a Novel Evidence Based Theory,” submitted to Hypotheses in the Life Sciences.
[28] S. Seneff, G. Wainwright and B. Hammarskjold, “Atherosclerosis may Play a Pivotal Role in Protecting the Myocardium in a Vulnerable Situation,” submitted to Hypotheses in the Life Sciences.
[29] H. Sinzinger and J. O’Grady, “Professional athletes suffering from familial hypercholesterolaemia rarely tolerate statin treatment because of muscle problems.” Br J Clin Pharmacol 57,525-528, 2004.
[30] E.J. Smart, G.A. Graf, M.A. McNiven, W.C. Sessa, J.A. Engelman, P.E. Scherer, T. Okamoto, and M.P. Lisanti, “Caveolins, Liquid-Ordered Domains, and Signal Transduction,” Molecular and Cellular Biology, 19, 7289–7304, Nov. 1999.
[31] A.J. Shyam Kumar, S.K. Wong, and G. Andrew, “Statin-induced muscular symptoms : A report of 3 cases.” Acta Orthop. Belg. 74, 569-572, 2008.
[32] M.A. Silver, P.H. Langsjoen, S. Szabo, H. Patil, and A. Zelinger, “Effect of atorvastatin on left ventricular diastolic function and ability of coenzyme Q10 to reverse that dysfunction.” The American Journal of Cardiology, 94(10):1306–1310, 2004.
[33] Y. Sunada, H. Ohi, A. Hase, H. Ohi, T. Hosono, S. Arata, S. Higuchi, K. Matsumura, and T. Shimizu, “Transgenic mice expressing mutant caveolin-3 show severe myopathy associated with increased nNOS activity,” Human Molecular Genetics 10(3) 173-178, 2001. http://hmg.oxfordjournals.org/content/10/3/173.abstract
[34] M. J. Taggart, “The complexity of caveolae: a critical appraisal of their role in vascular function,” Research Symposium on Caveolae: Essential Signalosomes for the Cardiovascular System, Proc Physiol Soc 19, SA21, University of Manchester, 2010.
[35] P. Thavendiranathan, A.Bagai, M.A. Brookhart, and N.K. Choudhry, “Primary prevention of cardiovascular diseases with statin therapy: a meta-analysis of randomized controlled trials,” Arch Intern Med. 166(21), 2307-13., Nov 27, 2006.
[36] R.S. Tilvis, J.N. Valvanne, T.E. Strandberg and T.A. Miettinen “Prognostic significance of serum cholesterol, lathosterol, and sitosterol in old age; a 17-year population study,” Annals of Medicine, Early Online, 1–10, 2011.
[37] J. Tong, P.P. Borbat, J.H. Freed, and Y. Shin, “A scissors mechanism for stimulation of SNARE-mediated lipid mixing by cholesterol.” Proc Natl Acad Sci U S A 2009;106:5141-6.
[38] L. Vila, A. Rebollo, G.S. AÄ‘alsteisson, M. Alegret, M. Merlos, N. Roglans, and J.C. Laguna, “Reduction of liver fructokinase expression and improved hepatic inflammation and metabolism in liquid fructose-fed rats after atorvastatin treatment,” Toxicology and Applied Pharmacology 251, 32–40, 2011.
[39] Walley T., Folino-Gallo P., Stephens P et al, “Trends in prescribing and utilisation of statins and other lipid lowering drugs across Europe 1997-2003,” Br J Clin Pharmacol 60, 543-551, 2005.
[40] K.A. Weant and K.M. Smith, “The Role of Coenzyme Q10 in Heart Failure,” Ann Pharmacother, 39(9), 1522-6, Sep. 2005.
[41] F. R. Westwood, A. Bigley, K. Randall, A.M. Marsden, and R.C. Scott, “Statin-induced muscle necrosis in the rat: distribution, development, and fibre selectivity,” Toxicologic Pathology, 33:246-257, 2005.
Stephanie Seneff can be contacted by email at seneff@csail.mit.edu
Related articles


Changes in Net Flow of Ocean Heat Correlate with Past Climate Anomalies
Press release from the University of Rochester:
August 14, 2009
Physicists at the University of Rochester have combed through data from satellites and ocean buoys and found evidence that in the last 50 years, the net flow of heat into and out of the oceans has changed direction three times.
These shifts in the balance of heat absorbed from the sun and radiated from the oceans correlate well with past anomalies that have been associated with abrupt shifts in the earth’s climate, say the researchers. These anomalies include changes in normal storm intensities, unusual land temperatures, and a large drop in salmon populations along the western United States.
The physicists also say these changes in ocean heat-flow direction should be taken into account when predicting global climate because the oceans represent 90 percent of the total heat in the earth’s climate system.
The study, which will appear in an upcoming issue of Physics Letters A, differs from most previous studies in two ways, the researchers say. First, the physicists look at the overall heat content of the Earth’s climate system, measuring the net balance of radiation from both the sun and Earth. And second, it analyzes more completely the data sets the researchers believe are of the highest quality, and not those that are less robust.
“These shifts happened relatively abruptly,” says David Douglass, professor of physics at the University of Rochester, and co-author of the paper. “One, for example, happened between 1976 and 1977, right when a number of other climate-related phenomenona were happening, such as significant changes in U. S. precipitation.”
Douglass says the last oceanic shift occurred about 10 years ago, and that the oceans are currently emitting slightly more radiation than they are receiving.
The members of the team, which includes Robert Knox, emeritus professor of physics at the University, believe these heat-flux shifts had previously gone unnoticed because no one had analyzed the data as thoroughly as the Rochester team has.
The team believes that the oceans may change how much they absorb and radiate depending on factors such as shifts in ocean currents that might change how the deep water and surface waters exchange heat. In addition to the correlation with strange global effects that some scientists suspect were caused by climate shifts, the team says their data shows the oceans are not continuously warming—a conclusion not consistent with the idea that the oceans may be harboring “warming in the pipeline.” Douglass further notes that the team found no correlation between the shifts and atmospheric carbon dioxide concentration.
“An interesting aspect of this research is that no reference to the surface temperature itself is needed,” says Knox. “The heat content data we used, gathered by oceanographers, was gleaned from temperature measurements at various ocean depths up to 750 meters.” The team also found that the radiative imbalance was sufficiently small that it was necessary to consider the effect of geothermal heating. Knox believes this is the first time this additional source of heat has been accounted for in such a model.
The team notes that it’s impossible to predict when another shift might occur, but they suspect future shifts might be similar to the three observed. Both Douglass and Knox are continuing to analyze various climate-related data to find any new information or correlations that may have so far gone unnoticed.
Related article

95% of Climate Models Agree: The Observations Must be Wrong
By Roy W. Spencer, Ph. D. | February 7th, 2014
I’m seeing a lot of wrangling over the recent (15+ year) pause in global average warming… when did it start, is it a full pause, shouldn’t we be taking the longer view, etc.
These are all interesting exercises, but they miss the most important point: the climate models that governments base policy decisions on have failed miserably.
I’ve updated our comparison of 90 climate models versus observations for global average surface temperatures through 2013, and we still see that >95% of the models have over-forecast the warming trend since 1979, whether we use their own surface temperature dataset (HadCRUT4), or our satellite dataset of lower tropospheric temperatures (UAH):
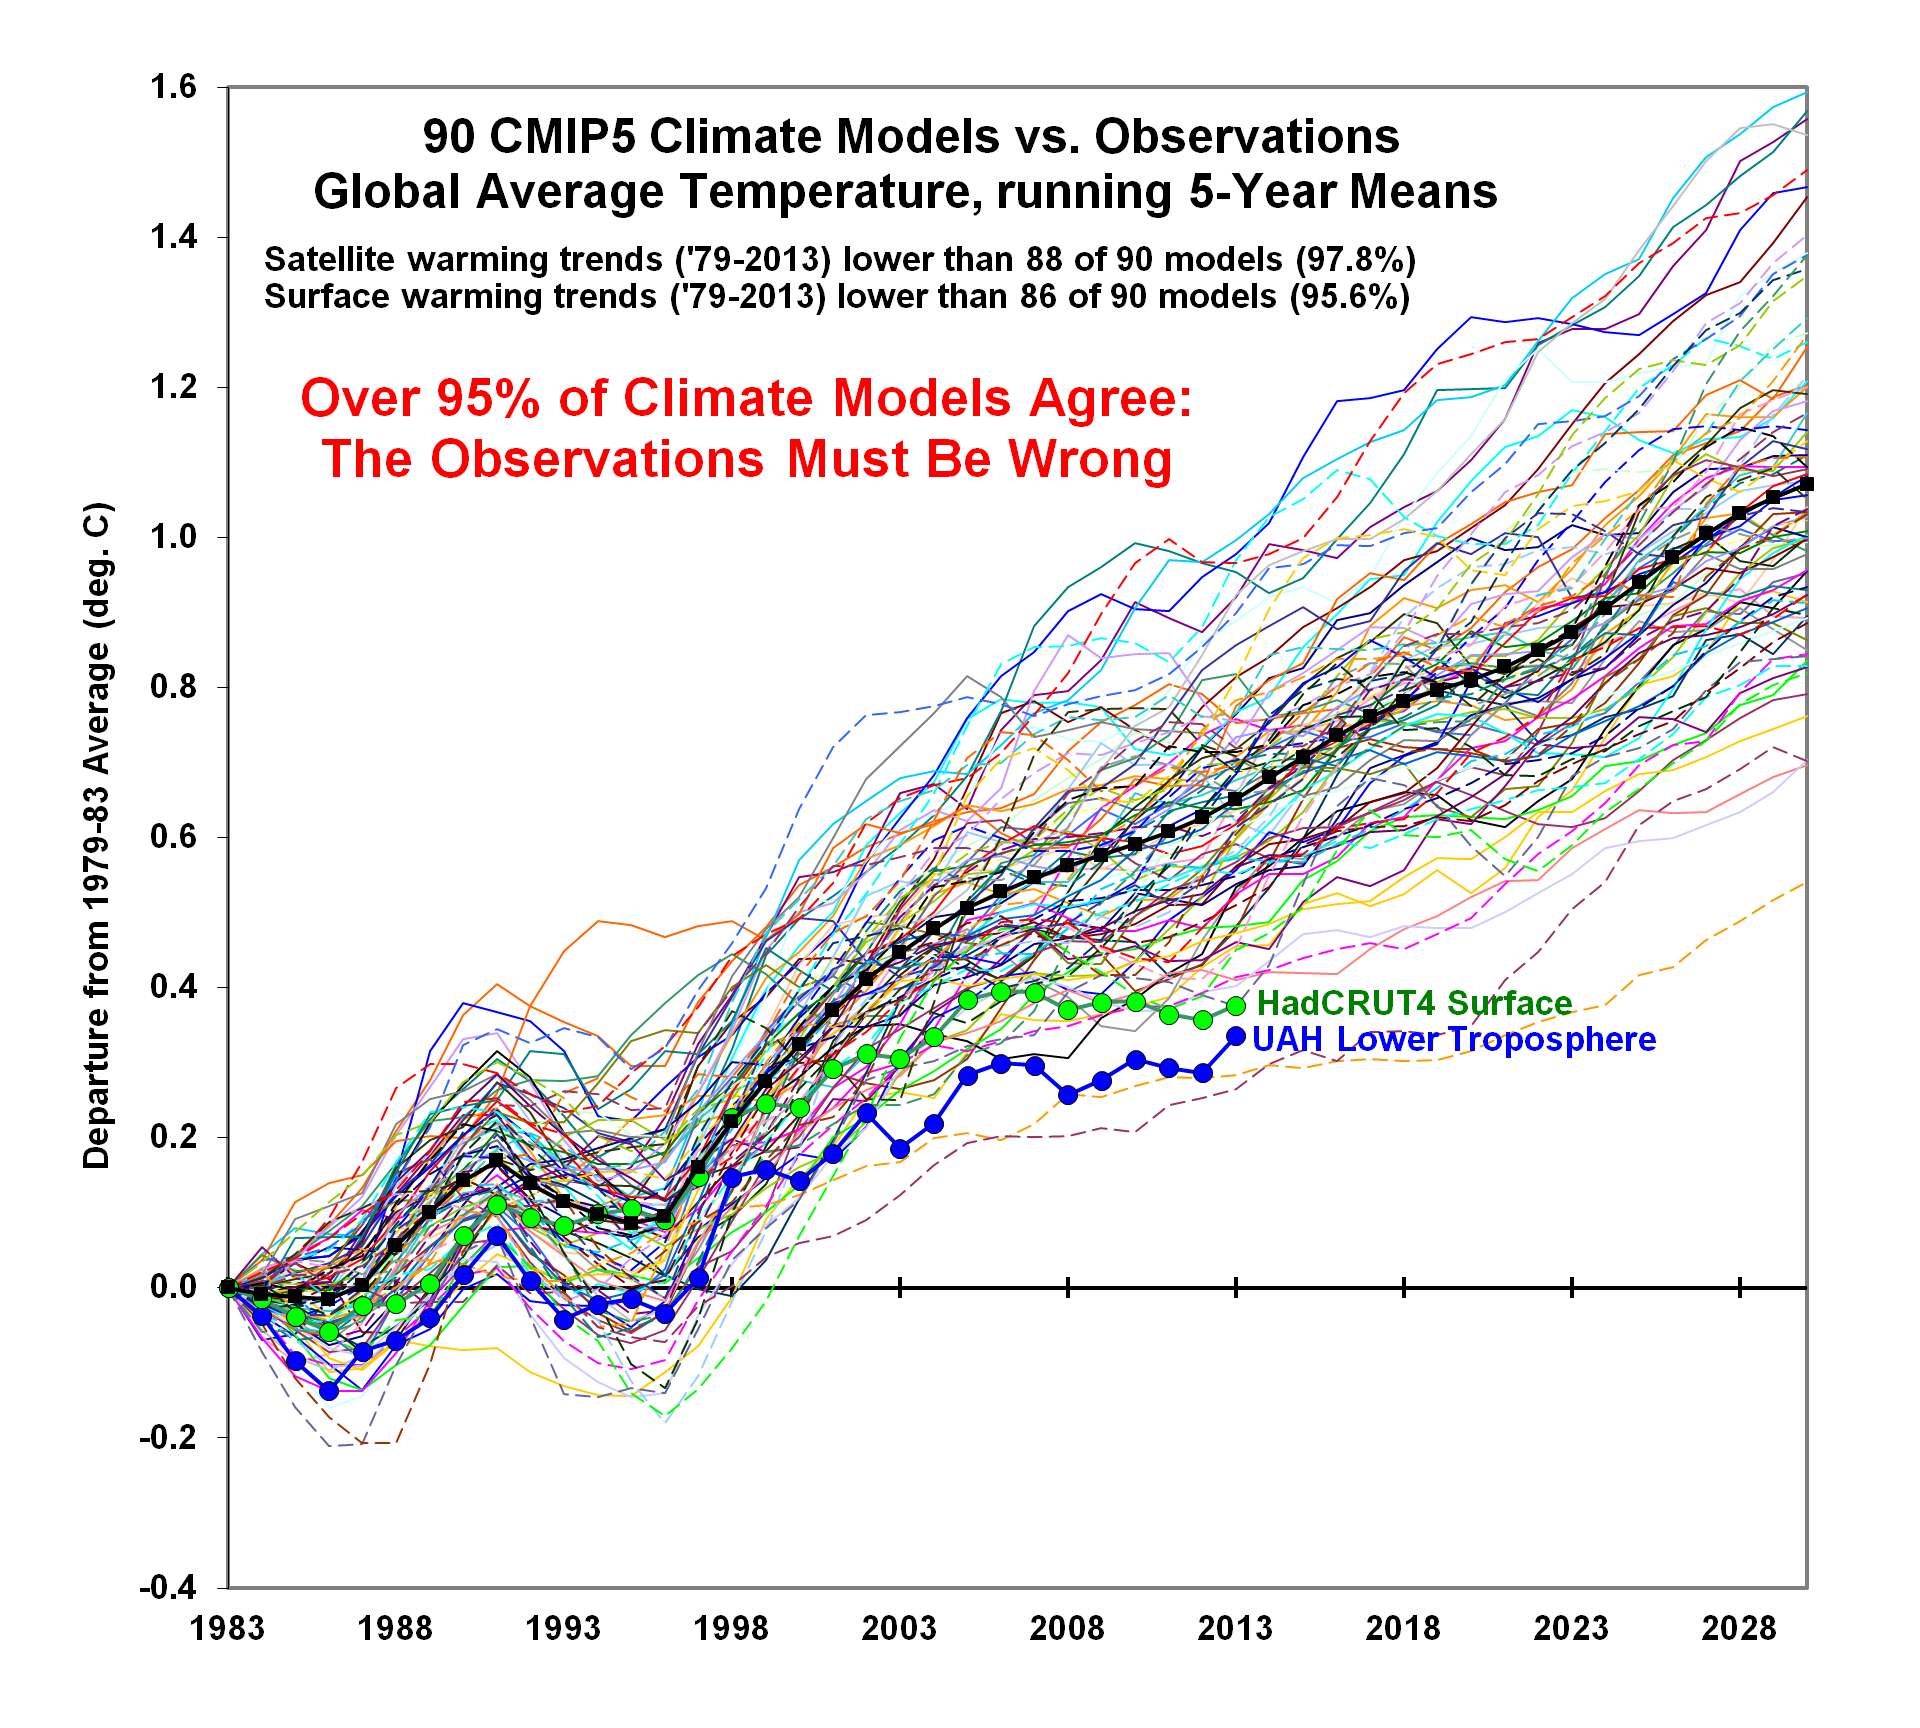
Whether humans are the cause of 100% of the observed warming or not, the conclusion is that global warming isn’t as bad as was predicted. That should have major policy implications…assuming policy is still informed by facts more than emotions and political aspirations.
And if humans are the cause of only, say, 50% of the warming (e.g. our published paper), then there is even less reason to force expensive and prosperity-destroying energy policies down our throats.
I am growing weary of the variety of emotional, misleading, and policy-useless statements like “most warming since the 1950s is human caused” or “97% of climate scientists agree humans are contributing to warming”, neither of which leads to the conclusion we need to substantially increase energy prices and freeze and starve more poor people to death for the greater good.
Yet, that is the direction we are heading.
And even if the extra energy is being stored in the deep ocean (if you have faith in long-term measured warming trends of thousandths or hundredths of a degree), I say “great!”. Because that extra heat is in the form of a tiny temperature change spread throughout an unimaginably large heat sink, which can never have an appreciable effect on future surface climate.
If the deep ocean ends up averaging 4.1 deg. C, rather than 4.0 deg. C, it won’t really matter.
~
Roy W. Spencer received his Ph.D. in meteorology at the University of Wisconsin-Madison in 1981. Before becoming a Principal Research Scientist at the University of Alabama in Huntsville in 2001, he was a Senior Scientist for Climate Studies at NASA’s Marshall Space Flight Center, where he and Dr. John Christy received NASA’s Exceptional Scientific Achievement Medal for their global temperature monitoring work with satellites. Dr. Spencer’s work with NASA continues as the U.S. Science Team leader for the Advanced Microwave Scanning Radiometer flying on NASA’s Aqua satellite. He has provided congressional testimony several times on the subject of global warming.
Dr. Spencer’s research has been entirely supported by U.S. government agencies: NASA, NOAA, and DOE. He has never been asked by any oil company to perform any kind of service. Not even Exxon-Mobil.
Dr. Spencer’s first popular book on global warming, Climate Confusion (Encounter Books), is now available at Amazon.com and BarnesAndNoble.com.
Manufacturer Tried to Hide Results of Testing of Blood Thinner Implicated in 1,000 Deaths
By Steve Straehley | AllGov | February 9, 2014
The manufacturer of a blood-thinning drug tried to hide results of an internal study that the manufacturer feared would hurt sales of the widely-advertised medication, according to recently-unsealed court documents.
Boehringer Ingelheim, manufacturer of Pradaxa, is being sued by patients and their families, charging it failed to properly warn users about possible dangers of the drug. More than 1,000 of those using Pradaxa have died from bleeding, Katie Thomas of The New York Times reported.
Some of the papers released by Chief Judge David R. Herndon of the United States District Court in East St. Louis, Ill., indicated that a research paper would contradict the company’s claims that regular blood monitoring is not necessary while taking Pradaxa. The lack of regular monitoring is one of the main selling points of the drug over warfarin, a drug long used in the prevention of blood clots and strokes. Warfarin requires frequent blood monitoring and attention to diet.
Boehringer Ingelheim emails released by the court show concern about the effect a change in recommended monitoring would have on sales of Pradaxa. “This may not be a onetime test and could result in a more complex message (regular monitoring), and a weaker value proposition … vs. competitors,” one employee wrote.
An email from another employee expressed concern about the drug’s safety risks in older patients, and said “there may be a role” for one or two blood tests in Pradaxa patients.
The case highlights the fact that much of the research on drugs is performed by the drug makers themselves, who have a financial interest in ensuring their products are approved by regulators.
The research paper, written by Paul A. Reilly, a clinical program director at Boehringer Ingelheim, found that some patients absorb too little of the drug to prevent strokes. It also said another group absorbs so much that they are at a higher risk for bleeding. These issues could be addressed with blood monitoring to ensure that patients have the proper levels of the drug in their bloodstream. Draft versions of the paper gave optimal levels of Pradaxa in a patient’s bloodstream.
Reilly’s paper was published in the February 2014 issue of the Journal of the American College of Cardiology, but some of the conclusions about blood monitoring that appeared in the draft version aren’t in the final report.
In a statement, Boehringer Ingelheim said the unsealed documents “represent small fragments of the robust discussion and debate that is a vital component in all scientific inquiry, and in the research and development of any important medication such as Pradaxa.”
One company supervisor, Dr. Jutta Heinrich-Nols, warned that publishing Reilly’s paper could make it “extremely difficult” for the company to defend its claims that Pradaxa did not require regular blood monitoring, the Times said.
In addition, there is so far no antidote to Pradaxa’s effects. With warfarin, physicians can administer doses of Vitamin K to counteract that drug’s effects in case a patient starts hemorrhaging.
The Justice Department has previously cited the company for intentionally making “unsubstantiated claims about the efficacy” of their drug Aggrenox, which is intended to prevent subsequent strokes, or strokes due to blood clots.
The Pradaxa documents were released the same week that Physicians for Integrity in Medical Research sued the Food and Drug Administration over the heart medication roflumilast, claiming it should be pulled off the market. The drug, made by Forest Laboratories and intended to treat chronic obstructive pulmonary disease (COPD), does more harm than good, according to the plaintiff.
To Learn More:
Study of Drug for Blood Clots Caused a Stir, Records Show (by Katie Thomas, New York Times)
New Emails in Pradaxa Case Show Concern Over Profit (by Katie Thomas, New York Times)
A Promising Drug With a Flaw (by Katie Thomas, New York Times)
Pradaxa Manufacturer Has History of Illegal Activities, Ties To Controversial Groups (by Alisha Mims, Ring of Fire)
Doctors Group Sues FDA to Withdraw Approval of Heart Drug (by Noel Brinkerhoff, AllGov)
Venezuelan University Developing Experimental Bamboo for Green Homes
By Ryan Mallett-Outtrim | Venezuelanalysis | February 6, 2014
Merida – Venezuelan researchers are studying ways to use bamboo to provide cheap, environmentally friendly housing.
With funding from the Ministry of Science, Technology and Innovation, students and educators at Venezuela’s Simon Bolivar University (USB) are undertaking research into improving the durability and lifespan of bamboo, along with conducting studies into possible uses of the material in housing construction.
Initial tests have already been carried out on experimental, reinforced bamboo developed at the university, according to a press release from the government’s National Foundation for Science and Technology (Fonacit). The foundation is supporting the study.
“The preliminary results were positive,” director of the USB’s Centre for Surface Engineering Professor Joaquín Lira stated.
Lira explained that the experimental bamboo has been strengthened with polymers mixed with ceramic powders. According to the professor, the reinforcing mixture succeeded in “plugging holes made by pests” and improved the uniformity of the material.
In a second phase of the study, researchers hope to construct a prototype apartment block with the reinforced bamboo. According to Lira, the modified bamboo is intended for future use as a “structural element for green, affordable housing”.
A mission to provide affordable housing to the country’s poor was launched by former president Hugo Chavez, has been continued under his successor, President Nicolas Maduro. By the end of last year, over 500,000 homes had been constructed since mid 2011 under the housing mission, according to the government. The Maduro administration has committed to constructing three million new homes by 2019. Although current construction figures are behind schedule, the government has pledged to speed up building.
Lira argued that bamboo is a logical choice for construction material in South America.
“Venezuela , Brazil and Colombia are countries with high production potential for… bamboo…adapted for construction,” Lira stated.
“In these countries, it’s estimated that there are 11 million hectares of bamboo,” the professor said.
The USB is sourcing its bamboo from 200 growers in Aragua state.
Bamboo is one of the fastest growing plants in the world. It can reportedly grow as much as 250cm in 24 hours, depending on climate and soil conditions. Lira also argued that bamboo is cheaper than other construction materials, strong and environmentally friendly.
However, the professor indicated that more research should be undertaken, particularly to reduce bamboo’s susceptibility to insects.
“Technically, we know little about bamboo [construction],” Lira stated, though the plant has been used in buildings for centuries.
“There are three story homes, bridges and churches built with this plant,” Lira said.
The research is expected to be completed by the first quarter of 2015.
Related article

Lakes For Sale, Partially Thawed, N=20
By Willis Eschenbach | Watts Up With That? | February 5, 2014
Anthony pointed out the selling of over-hyped claims of the “dramatic thinning” of Arctic ice here. The title of the underlying scientific study is much more prosaic, Response of ice cover on shallow lakes of the North Slope of Alaska to contemporary climate conditions (1950–2011): radar remote-sensing and numerical modeling data analysis. (PDF). To their credit, the authors make no such claims of drama in their text, which is generally quite appropriately restrained.
Here is their complete “dramatic” dataset of the lakes around Barrow, Alaska, the northernmost point in the US:
 Figure 1. Percentage of lakes in the low-lying tundra around Barrow, Alaska that are partially thawed in late April, 1992-2011. Photo Source.
It’s an interesting study. They noted that partially thawed lakes look very different on radar than when the same lakes are frozen solid. As a result, they’ve collected solid data that is not affected by urban warming. So … what’s not to like in the study? Let me start with what is to like in the study.
I do like the accuracy of the measurements. It’s an interesting metric, with very objective criteria. I like that they listed the data in their paper, and showed photos for each of the years. I like that they didn’t try to project the results out to 2080.
What I didn’t like is where their study went from there. After collecting all that great data, they immediately sent out for that perennial favorite, a global climate model … not my style at all.
So rather than pointing out that their study is models all the way down, I figured I’d just show the kind of analysis that I would do if I were handed the lake thawing data.
First thing I’d need for the analysis? MORE DATA. Piles and piles of data. So I went out and I dug up two datasets—Barrow temperature, and Barrow snow depths. I started with just the temperature, but it turns out that the correlation between temperature and the lake thawing isn’t all that good. It doesn’t explain much, the best correlation is with temperatures in December, 4 months prior to the thawing, at a correlation of 0.68. However, at least it gives a good idea of what’s been going on, because we have good records clear back to 1920.
 Figure 2. Winter temperatures in Point Barrow (pale blue line) and the 17 year Gaussian average of the data. Photo source http://www.panoramio.com/photo/63484316
I note in passing that Barrow has a well-documented Urban Heat Island that is at its strongest in winter … and despite that, the 1930s and 1940s both had warmer winters than the last decade. I also note in this context of winter-business-as-usual that the study says:
Climate-driven changes have significantly impacted high-latitude environments over recent decades, changes that are predicted to continue or even accelerate in the near future as projected by global climate models …
… but I digress.
So the next obvious suspect for a correlation with the lake thawing is the snow depth. It’s an odd fact of nature that snow is a good insulator. It both slows down heat transfer by insulating the surface, and it keeps the wind from contacting the ice.
So I looked at the average snow depth data (scroll down to “Custom Monthly Listing” in sidebar) … but it’s not all that good at emulating the ice thawing either—in fact it’s worse. With snow depth, the best correlation with average snow depth is only 0.51, again with December coming out on top. So, having investigated single variables to try to emulate the lake thawing, I turned to the combination of snow depth and temperature … not much luck there either. In fact, the only way I could get a good correlation was to use the combination of the Nov-Dec-Jan average temperature, and the December snow depth. This gave me a correlation of 0.81, and a p-value of 0.001 … which turns out to be just barely significant. Here’s the emulation:
 Figure 3. Emulation of Barrow lake thawing. Observations (thick red line) compares well with the emulation (thin green line). Correlation is 0.81, p-value is .0010.
Now … why did I say that a p-value of 0.001 is “barely significant”, when the usual level is a p-value of 0.05? Well … because I looked at so many possibilities before finding what I sought. All up, I looked at maybe 40 possibilities before finding this one. If you want to establish significance at the level of a p-value of 0.05, and you look at 40 datasets before finding it, you need to find something with a p-value less than 1-10(LOG(0.95)/N, where N is the number of datasets you looked at. For N=40, that gives a required p-value of better than 0.0013 … so with a p-value of 0.0010, my emulation just made it under the wire.
Next, I looked at what that same emulation would look like over the whole period 1950-2013 for which we have records, and not just the period 1992-2011 of the study (the “N=20″ of the title). Figure 4 shows that result.
 Figure 4. Exactly as in Figure 3, but covering the entire period of record.
OK … not a lot going on there. Now, those who follow my work know that I’m quite skeptical of this kind of modeling, particularly with such a short record. What I do to test that is first to find a model with an acceptable p-value. Then I take a look at both the emulation shown above, along with the same emulation using just the first half of the data to fit the parameters, and then the same thing using just the second half of the data. Figure 5 shows that result:
 Figure 5. As in Figure 4, but showing the emulation based solely on the first half of the data (light blue), and that based solely on the second half (dark blue)
As emulations go, in my experience that’s not bad. The general shape of the emulation is well maintained, and neither of the two half-data emulations go far off of the rails, as is all too common with this type of analysis.
So that’s how I’d analyze the data, at least to begin with. My conclusions?
Well, my first conclusion has nothing to do with the lakes. It has to do with Figure 2, which shows that there is nothing out of the ordinary happening to Barrow winter temperatures. So whatever you might want to blame the lake thawing on, it’s not the local temperature. It’s hasn’t much changed over almost a century, it just goes up for a while and then down for a while.
The second conclusion is that the changes in the lake thawing dates over the period of study are not “dramatic”. In fact, they are boringly mundane. The only thing “dramatic” is the press release, which is no surprise.
The third conclusion is that I wouldn’t trust my emulation of lake thawing all that far … the problem is that with N=20, we have so little data that any conclusions and any emulations will be fraught with uncertainty. Heck, look at Figure 1 … up until a few years before the end of the data there was not even much trend. It’s just too short to conclude much of anything.
Next, I wouldn’t trust their “CLIMo Lake Ice Model” much further than I’d trust my emulation above. Again, the underlying problem is lack of data … but to that you have to add the unknown performance of the CLIMo model.
Finally, while the authors were restrained in their study, they cut loose in their quotes for the press release, viz:
“We’ve found that the thickness of the ice has decreased tremendously in response to climate warming in the region,” said lead author Cristina Surdu, a PhD student of Professor Claude Duguay in Waterloo’s Department of Geography and Environmental Management. “When we saw the actual numbers we were shocked at how dramatic the change has been. It’s basically more than a foot of ice by the end of winter.”
and
“Prior to starting our analysis, we were expecting to find a decline in ice thickness and grounded ice based on our examination of temperature and precipitation records of the past five decades from the Barrow meteorological station,” said Surdu, “At the end of the analysis, when looking at trend analysis results, we were stunned to observe such a dramatic ice decline during a period of only 20 years.”
I see nothing “stunning” or “dramatic” in their results at all. Overall, it’s quite ho-hum.
My warmest regards to all, it’s bucketing down rain here after a long period of drought, life is good.
Bum Rap for the Rapa Nui
By Thomas Riggins | Dissident Voice | February 5, 2014
A new report in Science News Magazine (1-25-2014) by Bruce Bower details a reevaluation of the view that the Rapa Nuians, the native inhabitants of Easter Island (Rapa Nui), were responsible for the collapse of their population and society due to over exploitation of natural resources and the destruction of the rain forest on their island, a view recently popularized by Jared Diamond in his book Collapse (2005).
As Bower reports, the anthropologist Maria Mulrooney has published the results of her studies of the Rapa Nui culture (Journal of Archeological Science, December 2013) based on new radiocarbon dates from archeological sites on the island. She has concluded that after the clear cutting of the forest in the 1500s, to make room for agricultural production, the population of Rapa Nui remained sufficiently vibrant to carry on food production and continue their cultural development.
Exactly when the Rapa Nui arrived on Easter Island is unknown but it was on or before 1200 A.D. or so. Mulrooney maintains they had a thriving culture which was still going strong even after their “discovery” by the Dutch explorer Jacob Roggeveen on Easter Sunday 1722. This would indicate that they had not suffered “collapse” as a result of forest clearance.
Roggeveen reported that the island had about 2000 to 3000 inhabitants. He was the first to report on the moai– the giant statues (erected as religious symbols as part of an ancestor cult) for which the island is famous. They were all in place and standing when he was visiting the island (for less than two weeks). In his short time there he managed to kill a dozen or so natives and so his estimate of the population may be incorrect as many people fled and hid out until after he left.
The Spanish showed up in 1770, claimed the island for King Carlos III, then sailed away. The moai were all standing and the people were still engaged in agriculture. Captain Cook showed up in 1774 and noticed some of the moai had fallen but there was no sign of cultural “collapse.”
Bower quotes Mulrooney as saying, “Deforestation did not equal societal failure on Rapi Nui. We should celebrate the remarkable achievements of this island civilization”
Yet the culture did end up almost completely destroyed. After Capitan Cook’s visit Europeans visited more regularly in the 19th Century. It has been suggested that Rapa Nui’s decline may have been caused by the introduction of European diseases. By the early 1800s most of the moai had been toppled and the society had broken up into warring factions.
Peruvian slavers invaded in the 1860s and carried away 1500 of the 2000 or so Rapa Nuians into bondage in the mines of Peru. By 1878 only 111 natives were still living on the island. 97 per cent of the cultural memory of the people had been lost after contact with the Europeans. The greatest loss may have been that of rongorongo, the native writing system of Rapa Nui, and the only writing system created by any Polynesian group. All of those who knew the writing system died in the mines of Peru or from European introduced TB which ravaged the survivors.
Chile annexed the island in 1888. The Rapa Nui were given citizenship in 1966 but they no longer rule on their island. Of the 6000 or so people living on the island today about 3600 are Rapa Nui. The archeologist Carl Lipo is quoted as saying, “The idea of societal collapse on Rapa Nui has long been assumed but there is no scientific basis for it.” He is referring to a self induced collapse. Their traditional culture was destroyed, and the people today are trying to reinvigorate it, but it is a bum rap to blame them for the loss of their civilization.
Featured Video

No Vote, No Representation, No State: Democracy, Israeli Style
or go to
Aletho News Archives – Video-Images
From the Archives
Sanctions, War and the Policy of Dual Containment
By SASAN FAYAZMANESH | March 17, 2008
It is now nearly three decades since the Unites States adopted the policy of dual containment of Iran and Iraq. While much has been written about the containment of Iraq, there has been very little in-depth analysis of this policy when it comes to Iran. In a book that is going to be released on March 31, 2008, entitled The United States and Iran: Sanctions, Wars and the Policy of Dual Containment (Routledge), I attempt to address this shortcoming by investigating when and why the US policy of containment of Iran came about, how it evolved, and where it stands today.[1] To the extent that Israel has been involved in US policy making, the study will also include the role that Israel has played in the containment of Iran. Also, since the fate of Iran has been inextricably linked to that of Iraq, occasionally the investigation will overlap with the containment of Iraq.
The policy of dual containment of Iran and Iraq originated during the Carter Administration, but it was not until the Clinton Administration that the expression “dual containment” became popular. … continue
Blog Roll
 Aletho News
- No Vote, No Representation, No State: Democracy, Israeli Style
- Zionist Bought Senate Blocks Information About American Citizens Killed By Israel
- While Gaza dominates the UN, these are the people keeping it alive
- New Report: “Scholasticide and Genocide in Gaza: Assessment, Testimonies and Legal Analysis”
- ‘THAAD Delusion’: Iran war exposes US missile shield limits – The Atlantic
- Moscow issues warning to NATO over Russian exclave
- Yes, the Iran war has destroyed Trump’s presidency
- The fallacy of US delusions about Iran’s economic collapse
- Hezbollah denies Syria cell link, warns of Israeli plan to sow discord
- The legacy of US sanctions, war, and occupation in Iraq
- If Americans Knew
- Mamdani releases plan to combat antisemitism and hate crimes in New York City
- Iran’s Revolutionary Guards Publish Letter to the American People
- DMFI launches $1 million ad campaign supporting Virginia’s Elaine Luria
- US Senate blocks resolution seeking report on Americans killed by Israel
- Israeli Attacks Kill Ten Palestinians in Gaza
- Massacre at Minab: The School That Became a Grave
- Israeli media: The IDF Shows It Doesn’t Turn a Blind Eye; It Actively Emboldens Settler Havoc
- As settlers ravage West Bank, Israeli forces kill 10 in Gaza – Daily Update
- New Report: “Scholasticide and Genocide in Gaza: Assessment, Testimonies and Legal Analysis”
- Ex-Biden officials are desperate for a Gaza scapegoat
- No Tricks Zone
- Green Energy Debacle: German Expert Professor Fritz Vahrenholt Warns Of Severe Economic And Social Consequences
- Two More Paleo Reconstructions Affirm Meters-Higher Sea Levels Across Ireland, Brazil 7000-6000 Years Ago
- New Study: Earth And Venus Surface Warmth Largely Explained By Convection And Lapse Rate, Not CO2 Or Radiation
- 2025 Nature Paper Claiming Worsening Global Drought Gets RETRACTED …Heavily Flawed
- New Study: ‘Global Drought Shows No Detectable Recent Acceleration Under Climate Warming’
- Economic Masterminds: German Socialists Suggest Taxing Productivity Gains Stemming From Using AI
- The South China Sea Has Not Been Cooperating With The Climate Change Narrative
- Energy Crisis: Germany Enters Heating Season With Historically Low Gas Reserve Fill Levels
- New Study: The Antarctic Ice Sheet Gained Mass From 2020-2024 Due To Staggering Snow And Ice Accumulation
- Study: Ocean Heating Rates From Thousands Of Years Ago ‘Dwarf’ Modern Ocean Heating Rates

