The Delta Helter Skelter. When Dire Delta is the excuse for new lockdowns and vaccine mandates, but the truth keeps dribbling out.
Today more news from Israel
By Meryl Nass, MD | August 3, 2021
‘Helter-skelter’ means ‘in chaotic and disorderly haste’.
It seems a good descriptor of how public health mouthpieces are dealing with the facts oozing out of the public health muck regarding the Delta variant. Considering their strategy has been to use Delta to impose ever more harsh and unjustifiable Great Reset measures. Not to mention vaccine mandates. But now things look a lot worse than they did in that CDC slide deck. Check out these official graphs from Israel: not only are cases rising equally in the vaccinated as the unvaccinated, but the vaccinated are not being spared severe illness, as claimed by our plucky CDC director.
If nearly all the elderly and high risk Israelis have been vaccinated, then there would be some benefit of vaccination in warding off severe illness… but still, 2/3 of those with severe illness have been doubly vaccinated.
How can you spin this into a justification for vaccine mandates? You can’t. And unless the authorities can prove there is no ADE [antibody-dependent enhancement], getting a booster could just make things a whole lot worse.


[I think we should stop talking about this as a pandemic response. It is a coup, a Reset of the world as we knew it. The so-called responses simply served to terrorize the public and prolong the illness. ]
Med Schools Are Now Denying Biological Sex
![]()
By Katie Herzog | Bari Weiss’ Substack | July 27, 2021
During a recent endocrinology course at a top medical school in the University of California system, a professor stopped mid-lecture to apologize for something he’d said at the beginning of class.
“I don’t want you to think that I am in any way trying to imply anything, and if you can summon some generosity to forgive me, I would really appreciate it,” the physician says in a recording provided by a student in the class (whom I’ll call Lauren). “Again, I’m very sorry for that. It was certainly not my intention to offend anyone. The worst thing that I can do as a human being is be offensive.”
His offense: using the term “pregnant women.”
“I said ‘when a woman is pregnant,’ which implies that only women can get pregnant and I most sincerely apologize to all of you.”
It wasn’t the first time Lauren had heard an instructor apologize for using language that, to most Americans, would seem utterly inoffensive. Words like “male” and “female.”
Why would medical school professors apologize for referring to a patient’s biological sex? Because, Lauren explains, in the context of her medical school “acknowledging biological sex can be considered transphobic.”
When sex is acknowledged by her instructors, it’s sometimes portrayed as a social construct, not a biological reality, she says. In a lecture on transgender health, an instructor declared: “Biological sex, sexual orientation, and gender are all constructs. These are all constructs that we have created.”
In other words, some of the country’s top medical students are being taught that humans are not, like other mammals, a species comprising two sexes. The notion of sex, they are learning, is just a man-made creation.
The idea that sex is a social construct may be interesting debate fodder in an anthropology class. But in medicine, the material reality of sex really matters, in part because the refusal to acknowledge sex can have devastating effects on patient outcomes.
In 2019, the New England Journal of Medicine reported the case of a 32-year-old transgender man who went to an ER complaining of abdominal pain. While the patient disclosed he was transgender, his medical records did not. He was simply a man. The triage nurse determined that the patient, who was obese, was in pain because he’d stopped taking a medication meant to relieve hypertension. This was no emergency, she decided. She was wrong: The patient was, in fact, pregnant and in labor. By the time hospital staff realized that, it was too late. The baby was dead. And the patient, despite his own shock at being pregnant, was shattered.
Professors Running Scared of Students
To Dana Beyer, a trans activist in Maryland who is also a retired surgeon, such stories illustrate how vital it is that sex, not just gender identity — how someone perceives their gender — is taken into consideration in medicine. “The practice of medicine is based in scientific reality, which includes sex, but not gender,” Beyer says. “The more honest a patient is with their physician, the better the odds for a positive outcome.”
The denial of sex doesn’t help anyone, perhaps least of all transgender patients who require special treatment. But, Lauren says, instructors who discuss sex risk complaints from their students — which is why, she thinks, many don’t. “I think there’s a small percentage of instructors who are true believers. But most of them are probably just scared of their students,” she says.
And for good reason. Her medical school hosts an online forum in which students correct their instructors for using terms like “male” and “female” or “breastfeed” instead of “chestfeed.” Students can lodge their complaints in real time during lectures. After one class, Lauren says, she heard that a professor was so upset by students calling her out for using “male” and “female” that she started crying.
Then there are the petitions. At the beginning of the year, students circulated a number of petitions designed to, as Lauren puts it, “name and shame” instructors for “wrongspeak.”
One was delivered after a lecture on chromosomal disorders in which the professor used the pronouns “she” and “her” as well as the terms “father” and “son,” all of which, according to the students, are “cisnormative.” After the petition was delivered, the instructor emailed the class, noting that while she had consulted with a member of the school’s LGBTQ Committee prior to the lecture, she was sorry for using such “binary” language. Another petition was delivered after an instructor referred to “a man changing into a woman,” which, according to the students, incorrectly assumed that the trans woman wasn’t always a woman. But, as Lauren points out, “if trans women were born women, why would they need to transition?”
This phenomenon — of students policing teachers; of students being treated as the authorities over and above their teachers — has had consequences.
“Since the petitions were sent out, instructors have been far more proactive about ‘correcting’ their slides in advance or sending out emails to the school listserv if any upcoming material has ‘outdated’ terminology,” Lauren tells me. “At first, compliance is demanded from outside, and eventually the instructors become trained to police their own language proactively.”
In one point in the semester, a faculty member sent out a preemptive email warning students about forthcoming lectures containing language that doesn’t align with the school’s “approach to gender inclusivity and gender/sex antioppression.” That language included the term “premenopausal women.” In the future, the professor promised, this would be updated to “premenopausal people.”
Lauren also says young doctors are being taught to declare their pronouns upon meeting patients and ask for patients’ pronouns in return. This was echoed by a recent graduate of Mount Sinai Medical School in New York. “Everything was about pronouns,” the student said. The student objected to this, thinking most patients would be confused or offended by a doctor asking them what their pronouns were, but she never said so — at least not publicly. “It was impossible to push back without worrying about getting expelled,” she told me.
This hypersensitivity is undermining medical training. And many of these students are likely not even aware that their education is being informed by ideology.
“Take abdominal aortic aneurysms,” Lauren says. “These are four times as likely to occur in males than females, but this very significant difference wasn’t emphasized. I had to look it up, and I don’t have the time to look up the sex predominance for the hundreds of diseases I’m expected to know. I’m not even sure what I’m not being taught, and unless my classmates are as skeptical as I am, they probably aren’t aware either.”
Other conditions that present differently and at different rates in males and females include hernias, rheumatoid arthritis, lupus, multiple sclerosis, and asthma, among many others. Males and females also have different normal ranges for kidney function, which impacts drug dosage. They have different symptoms during heart attacks: males complain of chest pain, while women experience fatigue, dizziness, and indigestion. In other words: biological sex is a hugely important factor in knowing what ails patients and how to properly treat them.
Carole Hooven is the author of T: The Story of Testosterone, the Hormone that Dominates and Divides Us and a professor at Harvard who focuses on behavioral endocrinology. I discussed Lauren’s story with her and Hooven found it deeply troubling. “Today’s students will go on to hold professional positions that give them a great deal of power over others’ bodies and minds. These young people are our future doctors, educators, researchers, statisticians, psychologists. To ignore or downplay the reality of sex and sex-based differences is to perversely handicap our understanding and our ability to increase human health and thriving.”
A former dean of a leading medical school agrees: “I don’t know the extent to which the stories you relate are now widespread in medical education, but to the extent that they are — and I hear some of this is popping up at my own institution — they are a serious departure from the expectation that medical education and practice should be based on science and be free from imposition of ideology and ideology-based intimidation.”
He added: “How male and female members of our species develop, how they differ genetically, anatomically, physiologically, and with respect to diseases and their treatment are foundational to clinical medicine and research. Efforts to erase or diminish these foundations should be unacceptable to responsible professional leaders.”
There is no doubt the rules are changing. According to the American Psychological Association, the terms “natal sex” and “birth sex,” for example, are now considered “disparaging”; the preferred term is “assigned sex at birth.” The National Institutes of Health, the CDC, and Harvard Medical School have all made efforts to divorce sex from medicine and emphasize gender identity.
When Asking Questions Can Destroy Your Career
While it’s unclear if this trend will remain limited to some medical schools, what is perfectly clear is that activism, specifically around issues of sex, gender, and race, is impacting scientific research and progress.
One of the most notorious examples is that of a physician and former associate professor at Brown University, Lisa Littman.
Around 2014, Littman began to notice a sudden uptick in female adolescents in her social network who were coming out as transgender boys. Until recently, the incidence of gender dysphoria was thought to be rare, affecting an estimated one in 10,000 people in the U.S. While the exact number of trans-identifying adolescents (or adults, for that matter) is unknown, in the last decade or so, the number of youth seeking treatment for gender dysphoria has spiked by over 1,000 percent in the U.S.; in the U.K., it’s jumped by 4,000 percent. The largest youth gender clinic in Los Angeles reportedly saw 1,000 patients in 2019. That same clinic, in 2009, saw about 80.
Curious about what was happening, Littman surveyed about 250 parents whose adolescent children had announced they were transgender — after never before exhibiting the symptoms of gender dysphoria. Over 80 percent of cases involved girls; many were part of friend groups in which half or more of the members had come out as trans. Littman coined the term “rapid-onset gender dysphoria” to describe this phenomenon. She posited that it might be a sort of social contagion, not unlike cutting or anorexia, both of which were endemic among teenage girls when I was in high school in the ’90s.
In August 2018, Littman published her results in a paper called “Rapid-Onset Gender Dysphoria in Adolescents and Young Adults: A Study of Parental Reports” in the journal PLOS One. Littman, the journal, and Brown University were pummeled with accusations of transphobia in the press and on social media. In response, the journal announced an investigation into Littman’s work. Several hours later, Brown University issued a press release denouncing the professor’s paper.
Littman’s paper was republished in March 2019 with an amended title and other minor, mostly cosmetic changes. The journal has since confirmed that, while the paper was “corrected,” the original version contained no false information.
But Littman’s career was forever altered. She no longer teaches at Brown. And her contract at the Rhode Island State Health Department wasn’t renewed.
Littman is hardly alone. Trans activists have also targeted Ray Blanchard and Ken Zucker in Toronto, Michael Bailey at Northwestern, and Stephen Gliske at the University of Michigan for publishing findings they deemed transphobic. In a recent case, trans activists shut down research that was to be conducted by UCLA psychiatrist Jamie Feusner, who had hoped to explore the physiological underpinnings of gender dysphoria.
Nor is this limited to academia. Journalists who question the new ideological orthodoxy, like Abigail Shrier and Jesse Singal (with whom I co-host a podcast), have also been smeared for their work. After the American Booksellers Association included Shrier’s book, Irreversible Damage, in a promotional mailing to bookstores, activists went ballistic, prompting the ABA’s CEO to apologize for having done “horrific harm” that “traumatized and endangered members of the trans community” and “caused violence and pain.”
I had a similar experience in 2017 after writing about de-transitioners — people who transition to a different gender and then transition back — for the Seattle alt-weekly The Stranger. After the piece came out, people put up flyers and stickers around Seattle calling me transphobic; someone burned stacks of the newspaper and sent me a video of it. I lost many friends, and later ended up moving out of the city in part because of the turmoil.
But far more concerning than the treatment of journalists chronicling this story is the treatment of patients themselves.
Patients Are Suffering
Julia Mason is a pediatrician in the Portland suburbs who, unlike most doctors I spoke to, allowed me to use her name. Mason explained that she works at a small private practice and her boss is a libertarian. In other words: she won’t get fired for being honest.
Mason has been practicing for over 25 years, but it wasn’t until 2015 that she saw her first transgender patient: a 15-year-old trans boy who Mason referred to a gender clinic, where the patient was prescribed testosterone.
Since that first patient, she says there have been about 10 more requests for referrals to gender clinics. As this number increased, Mason started wondering about the advice her patients are getting at these clinics.
“A 12-year-old female came to see me, and the dad told me that they went to a therapist, and in the first five minutes, the therapist was like, ‘Yep. He’s trans,’” she told me. “And then they went to a pediatric endocrinologist who recommended puberty blockers on the first visit.”
Mason generally avoids prescribing puberty blockers, which inhibit the development of secondary sex characteristics like breasts or facial hair. The reason, she says, is that because there have been no controlled studies on the use of puberty blockers for gender dysphoric youth, the long term effects are still unknown. (In the U.K., a recent review of existing studies found that the quality of the evidence that puberty blockers are effective in relieving gender dysphoria and improving mental health is “very low.”)
In girls, Mason says, blockers inhibit breast development, but “you end up shorter, and the last thing a female who wants to look male needs is to be shorter.” Other side effects may include a loss of bone density, headache, fatigue, joint pain, hot flashes, mood swings and something called “brain fog.” In boys, blockers inhibit penis growth, which can make it harder for them to achieve orgasm and for surgeons to later construct those penises into “neo-vaginas,” a procedure known as vaginoplasty.
Trans activists often claim the effects of puberty blockers are fully reversible, but this remains unproven, and studies show that the overwhelming majority of teens who start on puberty blockers later take cross-sex hormones (testosterone for females and estrogen for males) to complete their transition. The combination of puberty blockers followed by hormones can cause sterility and other health problems, including sexual dysfunction, and the hormones must be taken for life — or until detransition. Little is known about their long-term effects. While the line that blockers are “fully reversible” is oft-repeated by activists and the media, last year, England’s National Health Service back-tracked this unsubstantiated claim on its website.
Mason is one of several doctors who voiced concerns about the fast-tracking of adolescents seeking to transition — and the new normal in the medical establishment, which seems to encourage that fast-tracking.
In 2018, the American Academy of Pediatrics recommended that pediatricians “affirm” their patients’ chosen gender without taking into account mental health, family history, trauma, or fears of puberty. The AAP recommendations say nothing about the many consequences, physical and psychological, of transitioning. So perhaps it is not surprising that surgeons are performing double mastectomies, or “top surgery,” on patients as young as 13.
One leading clinician, Diane Ehrensaft, has said that children as young as three have the cognitive ability to come out as transgender. And the University of California San Francisco Child and Adolescent Gender Center Clinic, where Ehrensaft is the mental health director, has helped kids of that age transition socially.
But not all clinicians have cheered these developments. In a paper responding to the AAP guidelines, James Cantor, a clinical psychologist in Toronto, noted that “every follow-up study of [gender dysphoric] children, without exception, found the same thing: By puberty, the majority of GD children ceased to want to transition.” Other studies of gender-clinic patients, stretching back to the 1970s, have found that 60 to 90 percent of patients eventually grow out of their gender dysphoria; most come out as gay or lesbian.
In an email to me, Cantor said: “The deafening silence from AAP when asked about the evidence allegedly supporting their trans policy is hard to interpret as anything other than their ‘pleading the 5th,’ as you in the U.S. put it.”
Erica Anderson, a clinical psychologist at the UCSF Child and Adolescent Gender Center Clinic and a trans woman herself, also voiced skepticism about the AAP’s approach to would-be transitioners. Unlike Mason, Anderson says withholding puberty blockers from dysphoric children is “cruel.” But she is suspicious of the sharp spike in young people, and especially young women. While she doesn’t like phrases like “rapid-onset gender dysphoria” or “social contagion,” she said something is definitely going on.
“What makes us think that gender is the one exception to peer influence?” she told me. “For 100 years, psychology has acknowledged that adolescence is a time of experimentation and exploration. It’s normal. I’m not alarmed by that. What I’m alarmed by is some medical and psychological professionals rushing kids into taking blockers or hormones.”
Because Anderson has been so vocal, including a recent 60 Minutes appearance in which she discussed detransitioners, she regularly gets calls from frantic parents. She told me she’d gotten off the phone with the parents of a 17-year-old who had announced that they were trans and wanted hormones. “It’s alarming to these parents,” Anderson said.
Anderson isn’t opposed to pediatric transition when patients are properly diagnosed, but she wants to see more individualized care rather than the activist-driven, one-size-fits-all approach. That, however, goes against current AAP guidelines.
Will Science Prevail?
Medicine is not impervious to trends.
“In the 90s, when I was training, everything was about controlling pain,” said a pediatrician in the Midwest who declined to be named for fear of repercussions. “We were taught that it was really hard to become addicted to narcotics. Look where that got us.”
Around the same time, she says, there was a rash of kids being diagnosed with bipolar disorder, something we now know is exceedingly rare in children. Before that, there was the recovered memory craze, multiple personality disorder, and rebirthing therapy, a bizarre treatment for attachment disorders that lead to the deaths of several children in the U.S. So how does this happen?
“Some idea will get picked up by major medical associations that put out reports and their members turn to those instead of the actual literature,” this pediatrician said. “And when you get too far ahead of the research, that’s when you get into trouble. That’s what’s happening now.”
For her part, Lauren, the medical student in California, is both hopeful for the future — and not. “On the one hand, I have this idea that the truth will eventually come out and science will ultimately prevail,” she said.
But the difference between things like rebirthing therapy or multiple personality disorder and the new gender ideology is that the latter is portrayed as a civil rights movement. “It seems virtuous. It seems like the right thing to do,” she said. “So how can you fight against something that’s being marketed as a fight for human rights?”
Why would you institute get tough policies and mandates exactly when the data show the vaccines are very leaky?
By Meryl Nass, MD | August 1, 2021
If your vaccine doesn’t necessarily protect you or me very well, you can’t achieve herd immunity and there is no societal justification to mandate the shot, or squeeze the unvaccinated.
Supposedly, CDC just figured this out. More to the point, the media just started reporting on it, mostly because of a leaked set of CDC slides.
So, it would appear that the only reason to get tough about the shots right now, would be to get them into arms before the public realizes the benefits are rapidly shrinking.
Pfizer applied for a full license, which would be the necessary condition to legally mandate the shots. But a poorly conceived and argued Office of Legal Counsel “opinion” was issued last week. It argues that mandates could be imposed under EUA.
It is unlikely that the feds would issue such a charged and difficult-to-defend document unless they needed it. They only need it if a license is not coming soon. Which suggests FDA has cold feet. Which is something new, considering how they licensed remdesivir. The data they have must be pretty bad. Maybe they are waiting for more data that will look better?
Just speculating…
Booster Jabs To Be Offered To 32 Million Brits From September
By Richie Allen | August 2, 2021
It is being reported this morning that booster jabs will be offered to 32 million Britons from next month. Pharmacies will play a key role in delivering 2.5 million doses a week.
It is hoped that while pharmacies administer the booster jabs, GP surgeries and hospitals can tackle the backlog of patients who are waiting for other treatments. According to The Telegraph :
All adults aged 50 and over, as well as the immuno-suppressed, will be offered the booster jabs.
The campaign could start as soon as Sept 6, which would see the rollout completed by early December if it goes to plan. It is hoped the timetable will leave at least a fortnight for the final people vaccinated to benefit from the jab’s effect before Christmas.
Proposals have been drawn up for the covid-19 vaccine to be co-administered alongside the flu jab with one injection in each arm mooted.
Apparently, ministers are considering giving people a different booster shot to the one they got for their first and second dose. Nobody in the mainstream media is asking any questions about the dangers of giving people two vaccines at once.
Nor is anyone questioning the need for booster jabs. As the flu jab rarely works (Google that statement if you don’t believe me) and they claimed that flu disappeared last year, how can they possibly prepare a jab for it?
As usual, the MSM is deaf dumb and blind. Nothing to see here. I’m beginning to get fairly alarmed. What sort of pressure will be brought to bear on people like me who will continue to tell them to stick their jabs where the sun doesn’t shine?
I don’t expect to travel internationally ever again. My days of going to concerts, the theatre, the cinema and restaurants are over. It’s devastating, but I can cope. However, they won’t stop there. They’ll do everything in their power, short of mandating the jabs, to coerce the rest of us to give in. It’s going to be a long Winter.
Does This Data From Public Health Scotland Show that Vaccine Effectiveness Against Death is Just 46%?
By Will Jones | The Daily Sceptic | August 2, 2021
How well do the vaccines protect from death? The two most recent weekly reports from Public Health Scotland give us death data by vaccination status, and by subtracting one from the other we can work out how many Covid patients died in the week July 9th-15th. The results are shown below.
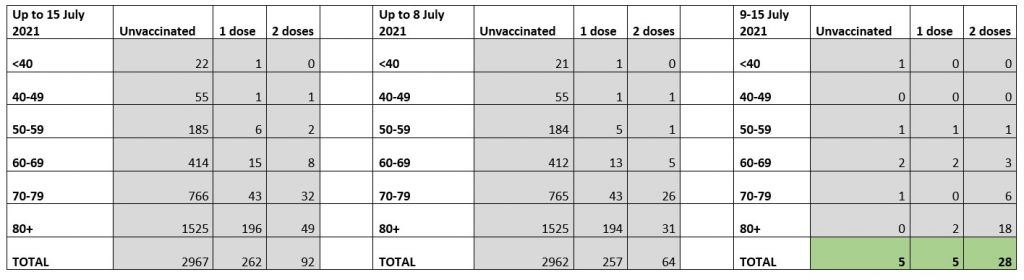
We see that 38 people died with Covid that week, 37 of whom were over 50. Twenty-eight (74%) were fully vaccinated (18 of whom were over 80 and 24 were over 70). Thirty-three (87%) had had at least one dose. Just five (13%) were unvaccinated.
To fully interpret these we need to know how many people were vaccinated in each age group. The problem with obtaining this information is that the official Scottish statistics appear to use the same method as the NHS for estimating vaccine coverage, which gives figures which exceed the likely more accurate estimates of Public Health England by around 5%.
This means the official Scottish figures show extremely high coverage in the over-60s, implausibly hitting 100% in three of the age bands. If we compare this to the latest PHE figures we can see that the corresponding figures in England, taken from the NIMS database, are more like 90-95% than 100%. In fact, the PHE figures are generally around 10 percentage points lower than the PHS figures for the under-70s. That’s a lot.
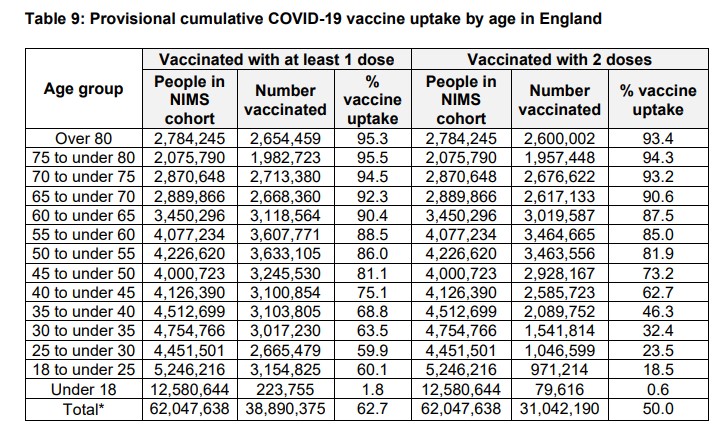
Even if the Scottish really are more keen on vaccination than the English (not unlikely, if only because of the smaller minority ethnic population), we know from the English figures that the NHS estimates appear, as mentioned, to overestimate vaccine coverage by around 5%. I’m going to use a very rough estimate then that around 93% of the over-50s in Scotland have had at least one dose (compared to around 90% in England) and around 91% are fully vaccinated (compared to around 88% in England).
Looking at just the deaths in the over 50s now (so dropping the one in the under 50s), this means that 89% of the deaths in the week 9th-15th July were in the 93% who were vaccinated with at least one dose; 76% of the deaths were in the 91% who were fully vaccinated; and 11% of the deaths were in the 7% who were unvaccinated. This does imply that the vaccines are having some protective effect, but not as much as we might have expected from other sources such as PHE which claim the vaccines are 75-99% effective against death.
Note that these figures suggest that those who had received only one dose were particularly vulnerable to death, as they made up only around 2% of the over-50s population but accounted for 14% of the deaths. Since almost all the over-50s had been offered two doses by this point, this means those who had only one may have had particular reason to avoid the second, such as a bad reaction to the first, or simply being otherwise more vulnerable.
We can use these figures to do a crude estimate of the vaccine effectiveness against death. The four deaths in the seven percent who were unvaccinated imply that if the vaccines have no effect there would have been 57 deaths in total (4/0.07), or 52 deaths in the 91% who were fully vaccinated. There were 28 deaths in the fully vaccinated, meaning the vaccines reduced the expected deaths among the over-50s by 46%. This is 46% overall protection, not protection in addition to protection from infection and hospitalisation, and is considerably below the 75-99% PHE estimate.
This is a very crude estimate, however, as 20 of the deaths were in the over-80s. Once we have more data from the recent surge we may be able to get a better estimate.
That big lie from last week – that 97% of hospitalized and 99.5% of deaths occur in the unvaccinated…
… Proven a lie by CDC’s own slide deck
By Meryl Nass, MD | August 1, 2021
This is from the slide deck leaked a few days ago from CDC:

2020 Was Another Quiet Tornado Season
By Paul Homewood | Not A Lot Of People Know That | August 1, 2021
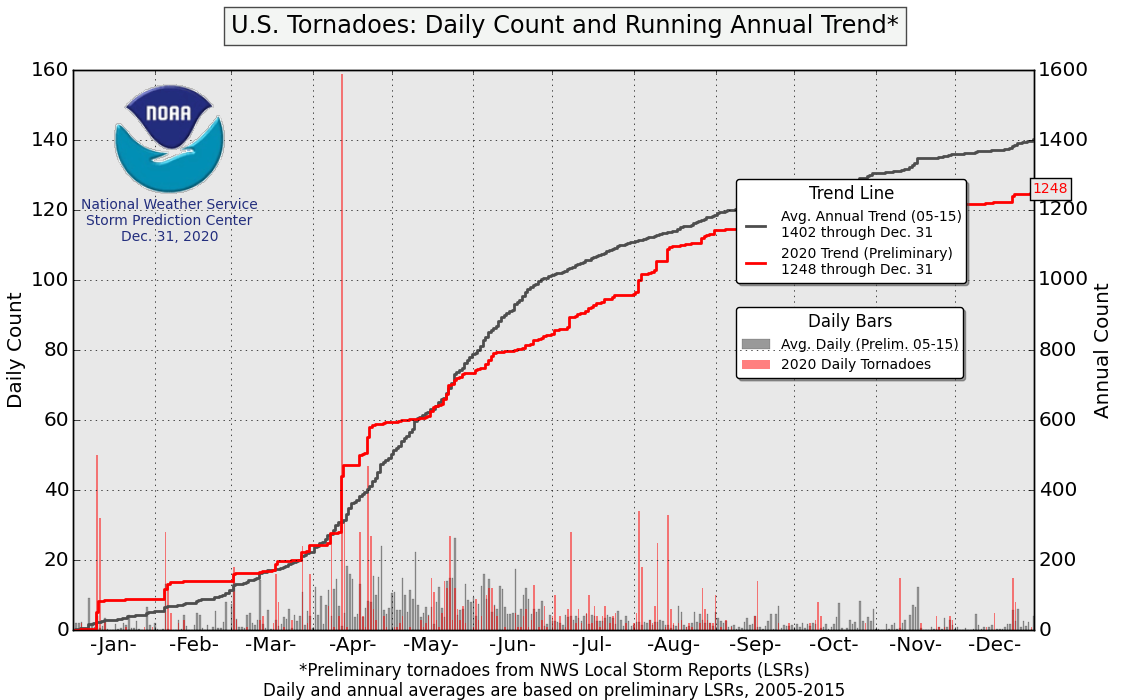
https://www.spc.noaa.gov/wcm/2020/ptorngraph-big.png
According to NOAA’s preliminary data, the number of tornadoes in the US last year was below average.
The full, finalised data has now been released, and it shows another very quiet year for the stronger tornadoes, EF-3s and greater:

Source: NOAA
There were twelve EF-3s, six EF-4s and no EF-5s at all. The number of these violent tornadoes shows a clear and continuing decline since the 1970s.
Particularly significant is the lack of EF-5s, the most powerful tornadoes, packing winds of over 200 mph. The most recent EF-5 was the Moore tornado in May 2013. As there have been none this year so far either, it means that we have now gone more than eight years without an EF-5. This is the longest such period on record, tied with 1999 to 2007.
With the introduction of Doppler radar in the 1990s, increased population, mobile phones and better monitoring systems generally, many tornadoes are now spotted and counted which would have been missed in the past. For that reason, NOAA advise that trends in stronger tornadoes give a better reflection of tornado activity, as these tornadoes would have likely been reported even during the decades before Doppler radar use became widespread and practices resulted in increasing tornado reports.
DR MIKE YEADON, DOCTORS FOR COVID ETHICS, DAY 2, SESSION 2
ArmerLainie@123 | July 31, 2021
Dr Mike Yeadon speaks with Dr Michael Palmer
The Triumphant March Toward 100% “Renewable” Electricity: Germany and California
By Francis Menton – Manhattan Contrarian – July 28, 2021
As a state or a country, if you want to have any status in the ranks of the climate virtuous, the key metric is your commitment to get most or all of your energy from “renewables” (mainly wind and solar) by the earliest possible date. Everybody is doing it, and you are nobody if you don’t get in on the bidding. Just a couple of weeks ago (July 14), according to Reuters, the European Commission entered a bid of 40% of final energy consumption from “renewables” by 2030. Back here in the US, the most recent bid from the Biden administration (from April 28) is a goal of 80% of electricity by 2030, which is ambitious on its own, although electricity is a minority of final energy consumption. Congress has yet to consider the Biden administration bid.
Within both the EU and the US, there are national and state champions that are far out-virtuing everybody else. In the EU, it’s Germany. Germany adopted its “Energiewende” way back in 2010 to transition its energy sector to wind and solar. Since then Germany has repeatedly ramped up its renewable energy targets. Most recently, in December 2020, Germany adopted by statute a binding goal of 65% of electricity from renewables by 2030. Here in the US, our champion is California. In California the governing law is the famous SB 100, enacted in 2018, which sets mandatory targets for the electricity sector of 60% from “renewables” by 2030 and 100% by 2045.
As readers here know, the Manhattan Contrarian from time to time has expressed a high degree of skepticism as to whether these mandatory targets are achievable in the real world. Indeed, I have often noted that at somewhere around 40 – 50% of electricity from “renewables,” it becomes impossible as a practical matter to increase the share of electricity from renewables just by adding more renewable capacity. As far as I am aware, no large jurisdiction to date has gotten its percentage of electricity generation from “renewables” up above 50% for any extended period of time. (If a reader can point me to an example, I will be very interested.)
But maybe I’m just a crank. Surely these geniuses in Germany and California must know what they are doing. So let’s check in on the latest news.
Germany
The website No Tricks Zone has a report on July 27 covering electricity output in Germany for the first half of 2021. The No Tricks Zone post is based on data compiled at a German website called Die kalte Sonne.
And the answer is that in the first half of 2020 Germany achieved the level of 50% of its electricity from “renewables.” But in 2021 that level fell back to 43%:
“The share of renewable energies in gross electric power consumption in the first half of 2021 fell from 50% to 43% compared to a year earlier,” Die kalte Sonne reports.
What happened? The wind just didn’t blow as much:
“The production of onshore and offshore wind energy decreased by 20%.” . . . The reason for the steep drop, according to the findings, was due to unfavorable weather conditions. “This year, especially in the first quarter, the wind was particularly still. . . .”
So did solar energy then pick up the slack? Unfortunately, no:
“[T]he sun output was low. . . . Solar energy output . . . rose a modest 2%.”
So how did Germany make up the difference? The answer will not surprise you:
“Coal energy saw a renaissance. Brown coal [lignite] power plants produced 45.8 terawatt-hours of the net power – that is the power mix that comes out of the outlet. That’s a strong increase of 37.6% compared to 2020, when only 33.6 terawatt-hours were produced. The net production by black coal power plants also increased, by 38.9% to 20.4 terawatt-hours after 14.4 terawatt-hours in 2020.”
Basically, Germany has hit the limit of what can be achieved by adding capacity of wind and solar power sources. To get to the higher levels of “renewable” market share that they have committed to, they will need to add large and rapidly-increasing amounts of grid-scale storage. So far, they have barely begun that process.
California
Perhaps you remember the excited headline from the LA Times from April 29: “California just hit 95% renewable energy.” April 29 was just the very day after President Biden had announced his goal of 80% of US electricity from “renewables” by 2030. Now California was already showing the world that they were way ahead and basically all the way to home plate:
Something remarkable happened over the weekend: California hit nearly 95% renewable energy. I’ll say it again: 95% renewables. For all the time we spend talking about how to reach 100% clean power, it sometimes seems like a faraway proposition, whether the timeframe is California’s 2045 target or President Biden’s more aggressive 2035 goal. But on Saturday just before 2:30 p.m., one of the world’s largest economies came within a stone’s throw of getting there.
(Emphasis in the original.). But maybe we shouldn’t get too excited just yet. First, although the author (Sammy Roth) says this was “95% renewable energy,” it turns out as you read further that he is only talking about electricity, which is only about 30% of energy consumption. And for how long did the renewables provide the 95% of electricity consumption?
Saturday’s 94.5% figure — a record, as confirmed to me by the California Independent System Operator — was fleeting, lasting just four seconds.
So what’s the real picture over the course of multiple months or a year? For that you’ll have to ignore the cheerleading reporters at the MSM, and try to find some aggregate statistics. Here are the figures from the California Energy Commission for the full year 2020. The total contribution to electricity supply from “renewables” is claimed to be 33.09%. Oh, but that includes 2.45% from “biomass,” 4.89% from “geothermal,” and 1.39% from “small hydro.” Take those out and you’re left with a big 24.36% from wind and solar. And since electricity is only about 30% of final energy consumption, that means that wind and solar are only contributing around 8% of total energy consumption in California.
Over at the website of California’s Independent System Operator (“CAISO”) they provide a chart for every day’s electricity production that dramatically illustrates the problem. California’s peak electricity demand is around 40 GW, generally occurring around 6 – 8 PM. The large majority of their “renewable” production is from solar. Their current solar capacity, on a sunny mid-summer day like today, provides around 12 GW from about 9 AM to 5 PM — and nothing the rest of the time, including at the time of peak usage. In the winter, the output is more like 8 GW from 10 AM to 4 PM, and nothing the rest of the time. So far, they have almost nothing in the way of grid scale energy storage. In the evening, they ramp up the natural gas plants, and import power from Arizona and Nevada — mostly natural gas, nuclear, and coal. Close to 30% of California’s electricity comes from imports from neighboring states.
Is California going to meet its statutory mandatory goal of 60% of electricity from renewables by 2030? I know which way I’m betting.
This Year’s “ Greenland Meltdown” Scare
By Paul Homewood | Not A Lot Of People Know That | July 30, 2021
Boy, they are getting desperate now!
From Sky:


In fact, until this week Greenland had barely had a summer at all, with heavy snow meaning that the ice mass was way above average for the time of year. Even with the latest melt, the cumulative ice mass balance is still about a quarter above the 1981-2010 mean:

http://polarportal.dk/en/greenland/surface-conditions/
According to DMI, the grey band indicates:

http://polarportal.dk/en/greenland/surface-conditions/
In other words, anything within that grey band has happened at one time or another since 1981. There is therefore nothing unusual at all about the June 28th melt, and it certainly does not mean Florida will get flooded. It is something that happens every summer.
Melting of ice in Greenland, as well as the opposite, snowfall, is determined by the weather. Whereas the last two months have been dominated by low pressure, this week has seen high pressure take over. High pressure means plenty of sunshine, which in turn is what melts the ice. It has nothing to do with carbon dioxide.
Weather forecasts suggest high pressure will remain for a few more days, before giving way to low pressure and more snow:

BBC Forecast 30th June
With the end of Greenland’s melt season just a couple of weeks away, it looks as if we will end up with a pretty much average ice mass balance.
As for claims that the Arctic is warming three times faster than the global average, the Arctic has actually been colder than normal this summer. It is usually only during winter when Arctic temperatures are above normal, when of course it makes no difference whatsoever.
And so far this summer Arctic sea ice extent is doing what it always done at this time of year:


http://ocean.dmi.dk/arctic/index.uk.php
Yet every year, we get the same fraudsters out, trying to persuade the gullible public that the Arctic is melting down rapidly.
Featured Video

House Resolution Calls for Tech Companies to Censor Speech
or go to
Aletho News Archives – Video-Images
Book Review
Alarmist climate science as a textbook example of groupthink
By Paul MacRae | May 1, 2012
… Groupthink was extensively studied by Yale psychologist Irving L. Janis and described in his 1982 book Groupthink: Psychological Studies of Policy Decisions and Fiascoes.
Janis was curious about how teams of highly intelligent and motivated people—the “best and the brightest” as David Halberstam called them in his 1972 book of the same name—could have come up with political policy disasters like the Vietnam War, Watergate, Pearl Harbor and the Bay of Pigs. Similarly, in 2008 and 2009, we saw the best and brightest in the world’s financial sphere crash thanks to some incredibly stupid decisions, such as allowing sub-prime mortgages to people on the verge of bankruptcy.
In other words, Janis studied why and how groups of highly intelligent professional bureaucrats and, yes, even scientists, screw up, sometimes disastrously and almost always unnecessarily. The reason, Janis believed, was “groupthink.” He quotes Nietzsche’s observation that “madness is the exception in individuals but the rule in groups,” and notes that groupthink occurs when “subtle constraints … prevent a [group] member from fully exercising his critical powers and from openly expressing doubts when most others in the group appear to have reached a consensus.”[2]
Janis found that even if the group leader expresses an openness to new ideas, group members value consensus more than critical thinking; groups are thus led astray by excessive “concurrence-seeking behavior.”[3] Therefore, Janis wrote, groupthink is “a model of thinking that people engage in when they are deeply involved in a cohesive in-group, when the members’ strivings for unanimity override their motivation to realistically appraise alternative courses of action.”[4]
The groupthink syndrome
The result is what Janis calls “the groupthink syndrome.” This consists of three main categories of symptoms:
1. Overestimate of the group’s power and morality, including “an unquestioned belief in the group’s inherent morality, inclining the members to ignore the ethical or moral consequences of their actions.” [emphasis added]
2. Closed-mindedness, including a refusal to consider alternative explanations and stereotyped negative views of those who aren’t part of the group’s consensus. The group takes on a “win-lose fighting stance” toward alternative views.[5]
3. Pressure toward uniformity, including “a shared illusion of unanimity concerning judgments conforming to the majority view”; “direct pressure on any member who expresses strong arguments against any of the group’s stereotypes”; and “the emergence of self-appointed mind-guards … who protect the group from adverse information that might shatter their shared complacency about the effectiveness and morality of their decisions.”[6]
It’s obvious that alarmist climate science—as explicitly and extensively revealed in the Climatic Research Unit’s “Climategate” emails—shares all of these defects of groupthink, including a huge emphasis on maintaining consensus, a sense that because they are saving the world, alarmist climate scientists are beyond the normal moral constraints of scientific honesty (“overestimation of the group’s power and morality”), and vilification of those (“deniers”) who don’t share the consensus. … Read full article
Blog Roll
 Aletho News
- Iran unveils new control measures over Strait of Hormuz transit
- House Resolution Calls for Tech Companies to Censor Speech
- Ceasefire no longer viable after 200 days of Israeli violations: Hamas
- Israeli strikes intensify across southern Lebanon, casualties reported
- Left in Disbelief: Israel in Panic over Hezbollah FPV Drone Nightmare
- Trump Taps Israel Lobbyist From Mossad Cutout FDD To Join Iran Negotiations
- Trump’s Blockade Snatches Defeat from the Jaws of Victory
- Geopolitics and Geoeconomics of the Strait of Hormuz
- Mali: a new front in the Western war on multipolarism
- CHD Scientist: CDC, FDA COVID Vaccine Safety Monitoring ‘Insulting, and Many People Are Injured’
- If Americans Knew
- Israel’s New Ambassador to the ‘Christian World’ Served as Envoy to Azerbaijan During the Ethnic Cleansing of Christians from Nagorno-Karabakh
- US set to sell $1B “Advanced Precision Kill Weapon System” to Israel – Daily Update
- Israeli Strikes Kill at Least 32 Across S Lebanon, Including Children – Amid “Ceasefire”
- Israel to pour $730m into propaganda arm amid reputational crisis
- Real Cost of Iran War Likely Double the $25 Billion Figure the Pentagon Gave to Congress
- Israel conducts farthest-ever strike in long history of attacks on Gaza humanitarian aid flotillas
- In Gaza, Israel commits 10+ ceasefire violations a day – Daily Update
- US ships 6,500 tons of munitions, equipment to Israel in 24 hours
- A New Library in Gaza Rises From the Ashes of Destruction
- Israel’s top Jewish religious body ‘refuses to condemn’ smashing of Jesus statue
- No Tricks Zone
- Wind Energy Is Toxic, Hazardous To Human Health, Scientific Review Shows
- Oversupply Of Volatile Solar Energy Leads To Record NEGATIVE Prices!
- New Study: Extreme Heat Records, Heatwaves, Extreme Cold Records Declining Across US Since 1899
- It’s The Cold, Stupid! Cold 20 Times More Lethal Than Heat, Multiple Studies Show
- European Institute For Climate And Energy: “Climate Debate is Seldom About Science”
- New Study: The Climate May Be 5 Times More Sensitive To Solar Forcing Than Commonly Assumed
- EV Industry Reached $70 Billion In Losses In 2024 Due To Delusional Green Ideologies
- Reality Check: Maldives Have Actually Grown In Size Or Remained Stable Over Recent Decades
- Abrupt Climate Change Also Occurred NATURALLY In The Past …25 Times During Last Ice Age
- Cave Discovery Reveals Today’s Desert Climates Were Recently Far Warmer, Wetter, Teeming With Life
