Politics and Psychiatry: the Cost of the Trauma Cover-Up
By Bruce E. Levine | CounterPunch | July 18, 2018
Despite increased spending on mental health treatment, mental illness disability and suicide rates have skyrocketed. “Perhaps more disturbingly,” notes clinical psychologist Noël Hunter, “recent evidence has demonstrated that as contact with psychiatric intervention increases, so too does completed suicide, suggesting the possibility that the current mental health system may be creating the very problems it purports to aid.” In Hunter’s recently published Trauma and Madness in Mental Health Services (Palgrave Macmillan, 2018), she asks, “Are we continuing to funnel money into a fundamentally broken system?”
For many on the Left, it is obvious that the military-industrial complex is devoted only to its own preservation and expansion, thus routinely jeopardizing national security and freedom—this despite many men and women serving in the U.S. military who care about national security and freedom. Far fewer on the Left recognize that the psychiatric-industrial complex (which includes the American Psychiatric Association and its Big Pharma financial partners) is also devoted only to its own preservation and expansion, thus routinely exacerbating emotional suffering—this despite many individual practitioners who want to help their patients.
The majority of psychiatrists and psychologists, owing to both ignorance and cowardice, routinely comply with diagnostic and treatment notions that pretend to be scientific but which have been politically and financially forged. There are, however, a handful of anti-authoritarian professionals who have rebelled, and Noël Hunter is one of them.
Hunter is a rare psychologist. She not only has extensive knowledge of the empirical research, but she herself was once diagnosed with serious mental illness, and she takes very seriously the insights of “experts by experience”—recovered ex-patients—who Hunter quotes throughout her book. Both objective and subjective sources make clear to Hunter that the essential cause for what is called serious mental illness is not some kind of biochemical or genetic defect but some kind of trauma, and that the essential remedy is healing from trauma. For critical thinkers who are not mental health professionals, Hunter’s assertions in Trauma and Madness in Mental Health Services may sound like simple common sense, but it is sense that is not common in the mental health profession.
Wisdom has been derailed by politics and misinformation in the mental health profession (as is the case for many other aspects of U.S. society). Despite what the general public repeatedly hears from the mass media, there is no actual science behind proclamations that “schizophrenia” or other “serious mental illnesses” are caused by a biochemical imbalance, a genetic flaw, or any other innate defect. After many years and much money spent attempting to prove defect theories, even establishment mental health has rejected the widely popularized chemical-imbalance theory of mental illness (though word of this rejection hasn’t gotten out to much of the U.S. general public or to even many practitioners).
In contrast, there is a great deal of scientific evidence showing that people diagnosed with schizophrenia and other serious mental illnesses are far more likely to have been victims of societal and familial trauma. Citing the empirical research, Hunter reports:
“Adverse experiences, particularly in childhood (such as physical and sexual abuse, parental separation, bullying, parental death, foster care, neighborhood violence, poverty, racism, etc.), have been demonstrated to have a direct and dose-response relationship (meaning the more adversity, the greater the risk) with adult mental health issues like hearing voices, suicidality, drug abuse, experiencing altered states of consciousness, extreme and intense emotions, fragmented sense of self, obesity, depression, paranoia, beliefs in conflict with consensus reality, anxiety, and more.”
A great tragedy for people viewed as biochemically defective rather than as victims of trauma is that such individuals who are already suffering are then stigmatized and marginalized owing to their defect status. Hunter reports that “ongoing efforts to combat stigma by asserting that ‘mental illness is an illness like any other’ are actually associated with increased stigma and increased efforts to distance oneself from those deemed mentally ill.”
Politics has long dictated a trauma cover-up. The significance of trauma, Hunter recounts, was obvious over a century ago to Pierre Janet, and so too did Sigmund Freud recognize the importance of sexual abuse as a cause of his patients’ problems. However, Freud then shifted his focus onto unconscious conflicts. While it took some courage for Freud to talk about repressed sexuality, it would have likely been reputation suicide if he had continued to focus on societal and familial trauma—this would have challenged those in society who had far greater status and influence than he had.
To be clear, modern psychiatry does not completely reject trauma as a cause of emotional suffering, and with good luck a patient can  get the kind of diagnosis in which trauma is taken seriously. Post-traumatic stress disorder (PTSD) was included in the American Psychiatric Association’s diagnostic bible, the DSM, in 1980. “This inclusion,” Hunter points out, “was largely the result of political efforts on the part of American veterans of war.”
Politics, not science, dictates not only the explanations for mental illnesses but their creation (as with the case of PTSD) and abolition, as was the case with homosexuality. By the 1970s, gay Americans, angry about their sexual preference being viewed as a disease and defect, finally had enough political power to compel the American Psychiatric Association to abolish homosexuality as a mental illness, and it was excluded from the APA’s 1980 DSM-III. Unfortunately, people diagnosed with schizophrenia and other serious mental illnesses lack the political power to change psychiatric dogma, and so they are seen as defective rather than as victims of trauma.
Phil Ochs sang: “There but for fortune may go you or I.” This is the reality when it comes to psychiatric diagnoses. You and I can exhibit the same behaviors, but whether you or I become a chronic psychiatric patient depends on our bad or good fortune. I’ve talked to many people who as teenagers and young adults innocently told their parents about voices that they were hearing and were then labeled by doctors as schizophrenic, resulting in long careers as mental patients. And I’ve talked with others who kept their voice hearing to themselves; these voices actually helped them have breakthroughs, and they have had no such careers as mental patients.
In a scientific sense, terms like “schizophrenia” are completely meaningless—wastebaskets to toss people who are behaving in ways that appear bizarre to doctors. Often what causes people acting in unusual ways to become chronically dysfunctional are their doctors’ problematic reactions and “treatments.” In other words, it is common for the source of chronic dysfunction to be physician-induced (iatrogenic) trauma.
In the real world of psychiatric diagnoses, probably the most important criteria for whether you are diagnosed with schizophrenia or dissociative identify disorder (DID) is how much your doctor likes you, and Hunter was likable enough to get a DID diagnosis. For reasons of dogma, not science, trauma is taken seriously for DID but not for schizophrenia (in which one is simply seen as defective). So, Hunter considers herself relatively lucky, and one senses her “survival guilt.”
Unlike many books critical of the psychiatric-industrial complex, Trauma and Madness in Mental Health Services offers a great deal of practical help for both practitioners and for those in emotional turmoil. In very concrete terms, Hunter offers chapters on what is helpful and what is not. The research, her own experience as a patient, and her discussions with other ex-patients inform her: “Relationships matter. Relaxation matters. Nutrition matters. Hope and purpose matter. Nature matters. Love matters.”
Professionals often waste their limited time obsessing over a diagnostic process that is scientifically invalid and unreliable. “Rather,” Hunter concludes, “what is more important is to take an individualized, collaborative, trauma-informed approach that is attuned to individual needs without making assumptions and considering the person’s subjective experiences as real and something to be respected.” It’s important, Hunter concludes, to help people find meaning and value in the adaptive nature of their atypical experiences.
In general, I have little hope for the mental health profession, but I have seen individual professionals rise above their desire for security and then revolt against the policies of institutions in the psychiatric-industrial complex. In academia, such rebellion can jeopardize one’s chances for tenure, yet a handful of educators are willing to take that risk. They care less about security than being remembered by their students for turning them on to a book in which they actually acquire knowledge about some very interesting human beings and that is of great value in helping them. Such a book is Noël Hunter’s Trauma and Madness in Mental Health Services.
Bruce E. Levine, a practicing clinical psychologist often at odds with the mainstream of his profession, writes and speaks about how society, culture, politics and psychology intersect. His most recent book is Resisting Illegitimate Authority: A Thinking Person’s Guide to Being an Anti-Authoritarian―Strategies, Tools, and Models(AK Press, September, 2018). His Web site is brucelevine.net
Roads Melt In Oz “Winter Heatwave”!!
By Paul Homewood | Not A Lot Of People Know That | July 8, 2018
This is typical of the garbage we get so often from so called newspapers:

BRITAIN is not alone in experiencing a record-breaking heatwave, with soaring temperatures across the world being blamed for multiple deaths.
Roads have melted in Australia…..
Up to 50 motorists were left with their tyres covered in bitumen that had melted on a stretch of road outside the Australian city of Cairns in northern Queensland. Tablelands regional mayor Joe Paronella said: ‘I have never seen anything like it.’ … Full article
You will probably smell fake news already!
In Australia it just happens to be winter at the moment, and temperatures in July tend to be the lowest of the year.
In the week prior to July 6th, when the Metro article was published, temperatures ranged from 24.2C to 27.7C, perfectly consistent with a monthly mean of 25.8C:

But what about all of that melting tarmac? After all. photos don’t lie!
It turns out it was due to a botched road repair job:
A botched bitumen job on a road in Queensland’s far north has caused chaos, with tyres covered in tar and vehicles having to be abandoned.
Other cars have been damaged by lumps of tar thrown off the tyres of trucks and cars on a stretch of the Millaa Millaa-Malanda Road on the Atherton Tablelands.
Authorities closed the road on Wednesday after more than a dozen motorists had to have tyres replaced after the bitumen lifted.
Vince Whalley, who runs a tyre shop at Malanda, 70 kilometres south of Cairns, told the ABC that damage to vehicles had been significant: “The tar coming off the tyres is knocking bumper bars loose, taking panels out underneath.”
He said one tourist paid $1200 for a new set of tyres.
Motorist Bridget Daley told the ABC her tyres were covered in bitumen, which had also flown off, striking her bumper bar and snapping it off.
“I was absolutely horrified to find that there was [75 millimetres] of bitumen coated around all four wheels of my vehicle,” she said.
“It was like we were insects caught in a spider’s web and we were sinking.
“There were people that were pulled up on the side of the road and they were in total and complete disbelief as to what had happened to their vehicles.”
Another driver posted to social media saying the roads were a disgrace.
“We now have chipped paint and windscreen damage to our brand new car,” Anissa Rasmussen wrote.
“We were stopped by police at Tarzali, 10 kilometres from our destination, because cars were broken down, covered in tar, with it coating their wheels.”
Tablelands Regional Council Mayor Joe Paronella said a change of weather led to the chaos.
“I have never seen anything like it,” he said.
Cr Paronella said a section of the road was repaired by a Main Roads contractor a week ago. There were initial problems when gravel failed to stick to the bitumen.
“We started getting reports in the middle of last week from people getting stones and gravel flying up everywhere,” he said. “We helped with brooms to get the gravel off.”
That was during a period of cold, wet weather. But Deborah Stacey, from nearby Jaggan, told News Corp the problems really started when the weather improved on Wednesday and the bitumen turned to glue.
“We had a week of cracked windscreens, RACQ have been doing three to four a day,” she said.
“Then as soon as the sun came out, it started sticking … There was emulsion everywhere; a lot of soft tar sprayed in big globs and sticking to trucks wheels.”
Small towns, including Jaggan, were isolated while the main road was closed.
Cr Paronella urged those who had been caught up in the issues to contact Main Roads.
“I would certainly be talking to the department about possible compensation,” he said.
A spokesperson for Queensland’s Department of Transport and Main Roads said it was aware of the issues. The road had re-opened, with speed restrictions, after emergency repairs.
Queensland’s Dept of Transport has advised motorists affected to submit claims.
Transport and Main Roads District Director Sandra Burke said about 60 motorists had so far contacted the department seeking compensation for damage caused to their vehicles.
‘The situation is completely unacceptable and I apologise on behalf of the department to all those people whose vehicles were damaged and travel plans disrupted by this extremely unusual event.
We became aware of an issue with about two kilometres of road surface on June 25 and immediately reduced the road speed from 80km/h to 60km/h, swept the road surface and put signs in place.
‘What occurred yesterday will be the subject of a departmental investigation in close consultation with the contractors.
‘We believe recent cold and wet weather followed by a period of warmer conditions combined to destabilise the road surface which effectively became a sticky substance. “
Sandra Burke has missed a trick here though. It would be much cheaper to do what the clowns at the Metro have done, and blame it all on global warming!
Latest Sea Level Junk Science
By Paul Homewood | Not A Lot Of People Know That | July 4, 2018
Latest sea level scare from Phys.Org :

As requested, I have spliced Svetlana Jevrejeva’s projections of a 1.8m sea level rise up to 2100 onto her own actual figures to 2010:

http://www.psmsl.org/products/reconstructions/jevrejevaetal2014.php
No comment!
History and Biblical Scholarship: Al-Quds Is Not Jerusalem
By Dr. Elias Akleh | Global Research | July 3, 2018
The Zionist Israeli state calls on the Old Testament/Torah as a historical document to prove its legality to “re-claim” Palestine; their god’s promised land. To assert this legality and the myth of the promised land Zionist Organization, since its establishment, had recruited the science of archaeology, employing western Christian biblical archaeologists, to provide the required “historic” proof of the right of the Jews; alleged modern Israelites, to Palestine. This became very critical after Julius Wellhausen; the biblical scholar and Professor Ordinarius of Theology and head of the German School of Biblical Criticism, published his 1883 book “Geschichte Israels”, later titled as “Prolegomena zur Geschichte Israels” claiming that the Old Testament/Torah stories were invented during the Babylonian exile to serve certain theological and political purposes.
American biblical scholars and archaeologists, such as William Fox Albright, were recruited to refute Wellhausen’s claims. Albright was endorsed by covertly Zionist financed Biblical Colloquium; a scholarly society devoted to the analysis and discussions of biblical matters, and the preparations, publication, and distribution of biblical literature to brainwash readers and students with a specific theological ideology. Albright, as well as other biblical archaeologists like him, was also honored (bribed) by the American Friends of the Israel Exploration Society. His writings; such as “Why the Near East Needs the Jews”, are flagrant racist Zionist propaganda ignoring the vast archaeological history of the indigenous Palestinians while emphasizing the fake unproven Israelites’ narrative in Palestine.
The western Christian biblical archaeologists and scholars were mostly Judeo-Christians believing that the Torah/Old Testament was a real historical precursor for the New Testament. Influenced by this biased theological training they needed to confirm the Torah’s narrative as a real history in order to authenticate their own distorted Christian belief. Their lack of understanding of the ancient Middle Eastern dialects, cultures, geography and social habits, had distorted their interpretations of the archaeological findings by attributing them to the Israelites and to Solomon and David eras based on their own interpretation of the Torah rather than on the true scientific archaeological research and investigation.
Through their distorted writings and teachings these false biblical scholars had perpetrated a historical genocide against the Palestinian history by ignoring the hundreds of thousands of years of history of Palestine before the reported Abraham’s immigration to the land. They considered Palestine as a mere empty background theater for the Israelites that gained importance only when Israelites occupied it.

Although many archaeologists and historians have their own innate personal private doubts about the biblical stories, due to lack of any true archaeological evidence, they did not dare to publish or to openly state their doubts for fear of Zionist reprisal. Thomas L. Thompson; a biblical scholar, theologian and university professor, who dared in his books such as “The Historicity of the Patriarchal Narratives” in 1974, “Early History of Israelite; People from the Written and Archaeological Sources” in 1992 and particularly “The Bible in History: How Writers Create a Past” in 1999, to cast doubts about the Torah’s narrative as a reliable historical evidence, and to suggest that the bible should be considered only as a literature rather than a historical book, was severely criticized by contemporary archaeologists dubbing him a biblical minimalist, and was kicked out of his teaching position from the Marquette University in Milwaukee, Wisconsin.
Since the establishment of the colonial Zionist state of Israel, especially between 1950 and 1960, archaeology became an Israeli national obsession seeking proof for their alleged roots in Palestine to justify and to assert their military occupation of the land. After 70 years of continuous archaeological excavations under and around the Haram al-Sharif and al-Aqsa Mosque (the alleged Israelite Temple Mount) looking for the alleged Solomon’s Temple, not a shred of evidence was found to substantiate the temple myth. Many Israeli archaeologists spent many years digging one site after another to be eventually disappointed due to lack of any evidence for any Jewish roots in Palestine. All the archaeological excavations revealed only the history of indigenous Palestinians and other invaders of the country such as ancient Egyptians, Persians, Greeks and Romans.
Jewish Israeli archaeologist Ze’ev Herzog, a professor in the Department of Archaeology and Ancient Near Eastern Studies at Tel Aviv University, had joined Yigael Yadin; an Israeli politician, military official and archaeologist, in conducting many excavations throughout Palestine. Finding no evidence of the alleged Jewish roots in Palestine he eventually agreed with Wellhausen’s findings and argued that the Exodus from Egypt probably never happened, the Ten Commandments were not given on Mount Sinai, and Joshua never conquered Palestine. He casted serious doubts on David’s and Solomon’s monarchies, stating that if they existed they were probably no more than tribal chieftains. He stated:
“The many Egyptian documents known to us do not make any reference to the sojourn of the Children of Israel in Egypt or the events of the Exodus … generations of scholars tried to locate Mount Sinai and the stations of the tribes of Israel in the desert. Despite all this diligent research, not one site was identified that could correspond to the biblical picture.”
A more devastating blow to the Zionist/Judaic myth was dealt by the revelations of the Jewish Israeli historian Professor Shlomo Sand in his lectures and book “The Invention of the Jewish People”. Professor Sand argues that the so-called Jewish people had never been one nation with one race, rather they came from different groups of people from different countries and different races (white European Jews, black African Jews, brown Middle Eastern Jews, and so forth) who adopted Judaism as their faith. He affirms that the contemporary “Jewish people” have no connection at all to ancient Israelites, and their history is just an invented myth. In an interview with the Israeli Ha’aretz he stated:
“The Romans did not exile peoples (Israelites) and they could not have done so even if they had wanted to. They did not have trains and trucks to deport entire populations. That kind of logistics did not exist until the 20th century. From this, in effect, the whole book was born: in the realization that Judaic society was not dispersed and was not exiled … There are no scientific evidence or record about the exile of Jews two thousand years ago.”
He also stressed his views that the present Israeli state is just a product of Zionist colonization and concluded that:
“Jews have no origin in Palestine whatsoever and therefore their act of so-called ‘return’ to their ‘Promised land’ must be realized as invasion executed by a tribal-ideological clan.”
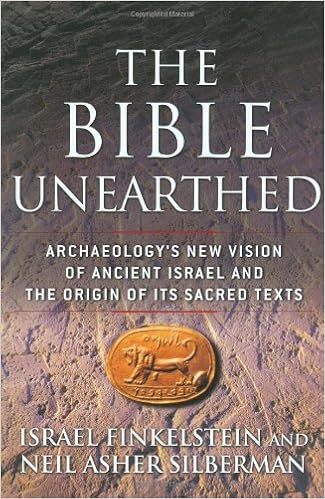
Another Jewish Israeli archaeologist; Israel Finkelstein; the director of the Sonia and Marco Nadler Institute of Archaeology at Tel Aviv University, states in his book “The Bible Unearthed: Archaeology’s New Vision of Ancient Israel and the Origin of its Sacred Texts” that many biblical stories had never happened but were written by what he calls “a creative copywriter” to advance a political agenda. He disputed the biblical description of Israel as a great empire with Jerusalem as its capital, where King Solomon had built a splendid temple, and stated that Jerusalem was just a small village with a small tribe and a small temple. He states:
“There is no archaeological evidence for it. There is something unexampled in history. I don’t think there is any other place in the world where there was a city with such a wretched material infrastructure but which succeeded in creating such a sweeping movement in its favor as Jerusalem, which even in its time of greatness was a joke in comparison to the cities of Assyria, Babylon or Egypt. It was a typical mountain village. There is no magnificent finding, no gates of Nebuchadnezzar, no Assyrian reliefs, no Egyptian temples – nothing. Even the (Solomon) temple couldn’t compete with the temples of Egypt and their splendor … Contrary to what is usually thought, the Israelites did not go to pray in Jerusalem. They had a temple in Samaria (today’s Sabastia) and at Beit El (Bethel).
The science of archaeology clearly shows that Jews have no roots in Palestine. Palestine was never ancient Israel, and Palestinian al-Quds was never Jewish Jerusalem. Many books of the Torah specifically and clearly mention this fact.
Many Arab historians, such as Dr. Kamal Salibi, Dr. Ahmad Daoud and Dr. Fadel Rabi’i, have written historical research books disputing the biblical narratives. This article will quote Dr. Fadel Rabi’i; an Iraqi Arab linguist, anthropologist and mythologist, since some of his books focused specifically on Palestine and al-Quds particularly; “Al-Quds is not Jerusalem, A Contribution to Correcting Palestine’s History” and “Imaginative Palestine: Land of Torah in Ancient Yemen” (two volumes) in Arabic. The geographical and historical accuracy of these two books were authenticated and confirmed by two present-day prominent Yemeni historians; Dr. Hussein Abdullah Al-Umari and Dr. Yousef Abdullah. As his main references Rabi’i relied heavily on the Torah in Hebrew language published by The Society for Distributing Hebrew Scripture, pre-Islamic Arabian poetry, “Geography of the Arabian Peninsula” by Jewish Yemeni Arab Hamadani; Hasan Ibn Ahmad Ibn Ya’coub al-Hamadani; an eighth century well-known geographer and traveler, and on the Greco-Roman geographer Ptolemy’s “The Geography”.
To understand Rabi’i’s studies one needs to have a thorough knowledge of the Middle Eastern geography especially of the Arabian Peninsula, understand the importance of the pre-Islamic poetry, and a thorough understanding of the ancient Semitic languages and most importantly the local dialects, without which translation into western languages would cause grave mistakes.
Arabian tribes in the Peninsula were identified by different attributive names. They were identified with the name of their chief; banu Israel or bani Israel as the children of tribal chief called Israel. Another identification was through their religious faiths; Jews or Yehud for worshipper of Yahweh, others are identified as Phallustins of Philistins (plural in Hebrew and totally different than the present-day Palestinians) for worshipper of the Phallus; the male sexual organ. Another identification was through the area of their residence; e.g. beit Yebose meaning the house of Jebusites, beit Lechem meaning the house of Lechem, or Hasidim who live in Hasid valley, and Hasmonim/Hashmonim who live in Hasad/Hashad area, or Mesrim/Mesraim who live in Mesrin in Yemen.
Relying on his references Rabi’i asserts that banu Israel and the Jews/Yehud were two separate Yemeni tribes, who fought among themselves, thus the Torah’s war story between kingdom of Israel (banu Israel) and kingdom of Judah (Jews/Yehud); (2 Samuel: 2). The Islamic Qur’an as well differentiated between banu Israel as a tribe and the Jews, who worshiped Yahweh. Arab poetry of pre-Islamic, of Umayyad and of Abbasid eras also mentioned banu Israel and Jews as separate Yemeni tribes.
Authentic Judaism/Yahudia is actually an ancient Arabic religion sprang in southern west Arabian Peninsula. Jews were Arabs, who worshiped Yahweh. In pre-Islamic and Islamic eras no one would consider being an Arab and at the same time a Jew was paradoxical. The same applies on Philistin Arabs; worshippers of the Phallus. Jewish Arabs and Philistin Arabs are no different than Christian Arabs.
Rabi’i’s main theme is that present-day Palestine has never been ancient Israel and that the city of al-Quds has never been Jerusalem, and that biblical stories took place in the south western area of the Arabian Peninsula, mainly in Yemen. He uses geographical locations described in many biblical books and compare them with locations mentioned in the references he relied on to prove his theory.
The first three chapters of the book of Nehemiah tells the story of the Persian king Artaxerxes releasing Nehemiah and other Jews from exile to go back to Jerusalem (ur-salm) to build its wall and the temple. Nehemiah 2:12 – 3:30 give detailed description and names of the damaged walls, gates and towers of Jerusalem/ur-Salm. The book mentions 10 gates; Valley Gate, Refuse Gate, Fountain Gate, Sheep Gate, Fish Gate, Old Gate, Water Gate, Horse Gate, East Gate and Miphkad Gate. Al-Quds city has only eight gates with totally different names. Other locations mentioned in Nehemiah, such as Serpent well, Broad wall, Pool of Shelah, King Garden, tower of Hundred, tower of Hananel, tower of the Ovens and governor residence beyond the river, are places and a river that do not exist in al-Quds. Apparently, Nehemiah was describing a different city (Yemini ur-Salm) than al-Quds.
Rabi’i also quotes other Torah books, particularly Joshua, that describes a totally different geography of another Jerusalem and another land. Joshua 12 lists the names of the kingdoms, whose kings were defeated by Joshua; Ai, Jarmuth, Lachish, Eglon, Gezer, Makkedah, Aphek and others. Present day Palestine never knew these kingdoms, many of whom were known in ancient Yemen. Joshua 14 – 21 divides the land among the tribes. The names of these divided territories were never known to and never existed Palestine.
Rabi’i also examined the names of Jewish tribes released from Persian exile. Ezra 8 has one list and Nehemiah 7 has another. The names in these lists are also detailed in Hamadani’s book as Yemeni Arab tribes. Palestine never knew these tribes. All geographical locations and names of Jewish tribes mentioned in the Torah’s books never applied to Palestine, but to ancient Yemen as described in details by Hamadani.
Examining the ancient Egyptian, Persian and Roman records Rabi’i could not find any mention of a “Palestine” until 330 A.D. mentioned in the ancient Roman Land Administration Records after Rome occupied the Levant area. Al-Quds was a small outpost on a hill called Elya/Eulia; a Roman name. Palestine then was populated mostly by Monophysite Christian Ghassanid and Nabatean Arabs. When emperor Constantine converted into Christianity he decided to enlist the local Christian population in his wars against the Sassanid Persian empire. He renamed the area Phalastine/Palestine and Elya/Eulia Jerusalem citing the names from the Torah. He also ordered the Torah to be translated from Hebrew to Greek. The translations were carried out mainly by Yemeni Jewish Rabbis, had many linguistic mistakes and political manipulations adopting the newly-named Palestine and Jerusalem as ancient Israel/Yehuda and ur-Salm.
Rabi’i argues that since the Torah was written around 500 B.C. and the name Palestine was first invented in 330 A.D. then Torah’s Philistin could never be present-day Palestine and Jerusalem/ur-Salm could never be al-Quds. Through lies and manipulations history is written by politicians, theologists, and victorious military leaders.
Judaism/Yahudia is a religion adopted by groups of different nationalities. We have Jewish Americans, Jewish Britons, Jewish French, Jewish Africans, Jewish Chinese, Jewish Khazars and so on. They have no national origin with Jewish/Yehud Yemeni Arabs.
Zionism, a colonialist ideology, has hijacked Judaism, as well as Christianity in the form of Judeo-Christianity, to lure Jews and Christians into the construction of the Great Israel project on the ruins of the Arab World starting with the occupation of the mischievously called Holy Land. The whole Arab World, with Palestine as its front, will never escape this colonial project and resurrect their true identity unless their history and religions; Christianity as well as Islam, are freed from the politically and religiously manipulated and erroneous Torah narrative.
***
Read also: Israeli Founder Contests Founding Myths
Dr. Elias Akleh is an Arab writer from a Palestinian descent born in the town of Beit-Jala. His family was first evicted from Haifa after the “Nakba” of 1948, then from Beit-Jala after the “Nakseh” of 1967. He lives now in US and publishes articles on the web.
Copyright © Dr. Elias Akleh, Global Research, 2018
Ever wonder where the 275 billion taxpayers money went that got poured down the EU carbon trading system hole?

By Tim Channon | Tallbloke’s Talkshop | June 28, 2018
Talkshop readers may remember a damning report by UBS about the billions of public money lost in the ETS carbon trading system. It calculated that if the money had been invested in modernising the European power generation fleet, CO2 could have been cut by 40% (and generate a huge number of high quality jobs). EU emissions rose 1.8% last year.
Despite all the recent turmoil over the UK steel industry and meetings in Brussels today, the reality is that the European Union has actually been subsidising the Chinese steel industry for years, in payments hidden amongst its efforts to combat Climate Change.
Using complex methods of carbon credits and carbon offsets, the EU devised rules on climate change ended up paying Chinese steel manufacturers billions to upgrade their steel mills and other energy intensive industry.
According to the analysis company, European Insights, almost €1.5 billion was paid to over 90 steel plants in China with the purpose of modernising them to consume less energy, and making the plants more efficient. Taken with the downturn in Chinese trade and the need for them to reduce world market prices to sell their product, the output of these mills has flooded onto the European market making steel products artificially cheap and endangering thousands of jobs in the UK. One plant alone, Anshan Iron and Steel, received a payment of €150 million to help pay for the installation of up to date equipment and replace the old inefficient Communist era machinery.
The money came from the EU’s self-claimed flagship Climate Directive, the Emission Trading System, and paid for by power and industrial companies in the EU who are, as part of their industry, emitters of carbon dioxide. This system forces big carbon emitters in Europe to buy carbon offsets, known as Certified Emission Reductions. They can buy these on the “carbon market” but companies in China, for example, who could show they intended to reduce their own levels of carbon emissions, would qualify.
The system then allowed Chinese steel producers to exploit a loophole that allowed their modernisation to be financed by the sale of these credits, as they received upfront payments of billions of Euros.
European installations that involve high energy consumption also can participate in this carbon trading market, but at a much lesser scale. Effectively around 12,000 European installations, including power stations and steel mills, were forced by the EU into subsidising Chinese industrial growth and development in a trade worth up to a total of €45 billion.
The Think Tank, European Insights, said: “These Chinese upgrades have now, sadly, assisted in record levels of Chinese steel production and are contributing to the low steel price that is endangering jobs in the UK. The system of carbon credit trading is highly complex, and we uncovered 91 individual steel mills in China that received funding of this nature. We estimate that the total paid to them was €1.4 billion.”
The EU approach to Climate Change is another example of the unintended consequences associated with policies made at an EU level. The initiative was well-meaning maybe, but failed totally to anticipate the consequences on world trade and impact on EU member states. Most damaging is that EU is also terribly slow to ameliorate the negative effects of its own policies.
The full report by European Insights can no longer be found here:
http://europeaninsights.org/carbon-credits-and-steel/
And you won’t find it on the wayback machine at Archive.org either
https://web.archive.org/web/20180628113838/http://europeaninsights.org?reqp=1&reqr=
HuffPost Blames Populists And Russia For European Renewable Policy Failures

By Eric Worrall | Watts Up With That? | June 26, 2018
The alleged Russian conspiracy which is supposed to be helping populists win elections worldwide has now been blamed for a fall in EU nation state support for European renewable energy policies.
How A Populist Europe In Thrall To Russia Threatens Climate Change Action
“We are in a really dangerous moment.”
By Arthur Neslen
26/06/2018 7:45 PM AESTAs a growing number of European countries tip toward the far right politically, attempts to curb climate change are coming under pressure. The region’s race to cut planet-warming greenhouse gases is generating friction, and some Members of European Parliament and experts point the finger of blame at Russian big energy interests and populist governments in thrall to them.
This month, a bid to raise the European Union’s supply of renewable energy to 35 percent of the electricity mix by 2030 was stymied by a bloc of EU states led by populist governments in the Visegrad countries ― Hungary, Poland, the Czech Republic and Slovakia ― even though it had the support of the European Parliament and European Commission.
The same bloc of countries helped whittle down proposals for a binding 40 percent energy conservation target, despite signs of accelerating climate change from the Antarctic to the African savannah.
“We see a pattern of populist governments clearly opposing ambitious climate and energy regulations, which is in line with the primary Russian economic interest: exporting fossil fuels and nuclear technology,” Benedek Jávor, the vice-chair of the European parliament’s environment committee and a Hungarian Green MEP, told HuffPost.
Russia supplies more than a third of Europe’s gas but this could be reduced to nothing by an ambitious energy saving target, according to analyses by several think tanks and consultancies.
…
Hungary, for example, which is becoming an increasingly authoritarian government under far-right leader Viktor Orbán, is a valued advocate for Russian gas infrastructure and is also building a Russian-financed €10 billion ($11.5 billion) nuclear reactor outside Budapest.
…
Russia’s energy agenda plays to a wider audience than extreme nationalists. Gas and nuclear are both seen as relatively lower carbon options than coal, which could “bridge” the path to a mid-century world powered solely by renewables. However, some climate studies suggest that, where gas is concerned, the bridge could also burn the chances of limiting global warming to no more than a 2 C temperature rise above pre-Industrial levels ― the target the majority of scientists say cannot be exceeded if we are to avoid the worst effects of climate change.
Several academic papers have found that investment in gas could crowd out desperately needed funds for renewable energy while providing few emissions-cutting benefits.
…
Full article: https://www.huffingtonpost.com.au/entry/europe-populism-russia-climate-action_us_5b30b86fe4b0321a01d33adf
In my opinion HuffPost are making it up as they go. If renewable energy was viable, gas wouldn’t have an opportunity to “crowd out” renewable investment, because renewable investment would make sense on its own terms.
As for Huffpost’s evidence free allegation that Russia is pushing populism to undermine the green agenda, in my opinion it would make far more sense for the Russian government to support the green agenda – to support anti-fracking, anti-nuclear and renewable energy advocacy movements.
More fracking in Europe would undermine Russian gas sales. A Nuclear power renaissance in Europe would undermine Russian gas sales. Useless green energy “investments” not so much.
Of course I’m not suggesting Russia is doing anything of the sort. Why risk scandal and exposure, when liberal green European politicians are doing everything in their power to wreck European energy independence without outside help?
UN Climate Demand Opens the way for More Abuse of Poor Farmers
By Eric Worrall | Watts Up With That? | June 22, 2018
If there is one climate program which should have died in a welter of shame, that programme is third world conservation programmes, programmes which have reportedly already caused mayhem in places where government backed forces have committed atrocities to drive farmers and tribes out of nature reserves.
Forests provide a critical short-term solution to climate change
22 JUN 2018
To prevent the worst consequences of climate change, we need to act now.
There is a “catastrophic climate gap” between the commitments that countries have made under the Paris Climate Agreement and the emissions reductions required to avoid the worst consequences of global warming, according to UN Environment’s Emissions Gap Report 2017.
The Paris Agreement aims to strengthen the global response to the threat of climate change by keeping a global temperature rise this century well below 2˚ Celsius, and to pursue efforts to limit the temperature increase even further to 1.5˚ Celsius.
Current pledges from governments represent only about half of what would be required to avoid a 2˚C temperature rise, and just one third of what’s required to limit warming to 1.5˚C.
While this “emissions gap” is significant, UN Environment suggests it can still be closed in a cost-effective manner.
One of the major contributors to closing the gap is forests.
The good news here is that 6.3 gigatons (billion tons) of carbon dioxide emission reductions have already been reported over the past six years from forests in Brazil, Ecuador, Malaysia and Colombia alone under the UN Framework Convention on Climate Change (UNFCCC), according to the UNFCCC Lima Hub. This is equivalent to more than the annual emissions of the United States.
“This is a significant step forward, showing that forests can be a central part of the solution to climate change,” says the head of the UN-REDD Programme Secretariat, Mario Boccucci. “We have an unprecedented opportunity: political will, know-how, finance. Now we need to build on progress and scale up rapidly in the coming years.”
…
Protecting forests, including mangroves, makes climate action cheaper and faster. We need to build the political case for this across all countries.
“The Emissions Gap Report once again underscores the urgency of redoubling our efforts to reduce emissions,” says UN Environment climate change expert Niklas Hagelberg.
“It shows that solutions exist, and if they are adopted quickly we can turn our current situation around. But with each year we wait, we make our ability to limit dangerous climate change more difficult, risky and costly.”
Full article: https://www.unenvironment.org/news-and-stories/story/forests-provide-critical-short-term-solution-climate-change
Even the Guardian has noted the connection between offering large cash grants to tyrants in return for declaring regions off limits to humans, and vicious attacks against people living in the affected regions;
The tribes paying the brutal price of conservation
John Vidal
Sun 28 Aug 2016 17.00 AESTAcross the world, governments are protecting habitats. But indigenous peoples are being evicted
The Botswana police helicopter spotted Tshodanyestso Sesana and his friends in the afternoon. The nine young Bushmen, or San, had been hunting antelope to feed their families, when the chopper flew towards them.
There was a burst of gunfire from the air and the young men dropped their meat and skins and fled. Largely through luck, no one was hit, but within minutes armed troops arrived in a jeep and the nine were arrested, stripped naked, beaten and then detained for several days for poaching in a nature reserve.
Welcome to 21st-century life in the vast Central Kalahari game park, an ancient hunting ground for the San, but now off-limits to the people who forged their history there. The brutal incident took place last week, just days after Botswana’s wildlife minister Tshekedi Khama, the brother of President Ian Khama, announced a shoot-on-sight policy on poachers.
Khama claims the policy, which is supported by conservation groups, will deter poaching and the illegal wildlife trade, which is widely seen by Europe and the US as disastrous for biodiversity. But there are no rare or endangered species such as elephants or rhinos in the areas where the bushmen hunt. Sending a helicopter gunship and armed guards to arraign the hunters looks rather like an escalation of the low-grade war that Botswana has waged for years on one of the most vulnerable indigenous groups in the world.
…
Full article: https://www.theguardian.com/global-development/2016/aug/28/exiles-human-cost-of-conservation-indigenous-peoples-eco-tourism
The damage is not limited to shooting down tribespeople from helicopter gunships. In Ivory Coast, poor farmers who are trying to produce cocoa are being pressured to pay large bribes to be allowed to work their farms in “conservation areas”.
… The government of Ivory Coast took action recently against cocoa-driven deforestation by expelling cocoa farmers from Mount Péko National Park (which means “mountain of hyenas” in the local Gueré language). According to a report by Human Rights Watch and the Ivorian Coalition of Human Rights (RAIDH), the evictions were poorly planned and carried out in violation of human rights standards. When we visited Mount Péko after the eviction, we found the park once again filled with cocoa smallholders who had returned. Some smallholders explained to us that when they finally returned to Mount Péko, they simply paid the authorities higher bribes to go back to cultivating their lands in the park. …
Read more: http://www.mightyearth.org/wp-content/uploads/2017/09/chocolates_dark_secret_english_web.pdf
Lets see – large numbers of skilled but very poor farmers in Africa trying to make an honest living being backed into a corner, forced to pay large bribes, their families brutalised by armed thugs. Its pretty obvious what will happen next, and when it does, Western green policies will bear the ultimate blame.
Can Universities Lawfully Bully Academics into Silence?
By Jennifer Marohasy | June 19, 2018
Dr Peter Ridd has taken James Cook University to court protesting his sacking for what he says is, primarily, speaking-out about the lack of quality assurance in Great Barrier Reef science.
Dr Ridd spoke out initially about there being no quality assurance of Great Barrier Reef science – science that is arguably misused to secure billions of dollars of tax-payer funding. When the University tried to stop Dr Ridd doing this, Dr Ridd spoke out against University management – making all the documentation public including on his new website.
I would really like the court case to be about academic freedom and the science – to lay bare the evidence. But when I went to the first day of the hearing of an application in the Federal Circuit Court last Monday (11th June – the hearing continued on 12 June 2018) for an order for reinstatement of Dr Ridd’s employment pending determination at trial, it quickly became evident that there would be no testing of the actual scientific evidence relied upon by Dr Ridd to claim that scientific institutions like AIMS and ARC Centre “can no longer be trusted” and “spin their story”.
Yesterday (19th June), Judge Jarrett gave his reasons for making orders declining to reinstate Dr Ridd but allowing him to amend his primary application to include a claim for the university taking “adverse action” against him for exercising a workplace right (i.e. his intellectual/academic freedom pursuant to the enterprise agreement). On hearing the reasons I was concerned to discover that it may all come down to poorly worded clauses in an enterprise agreement. In particular, was Dr Ridd allowed to exercise his academic freedoms free of the constraint of the university’s ‘aspirational’ (according to His Honour) code of conduct, and was he permitted to say anything publicly about what many ordinary Australians would consider a straight-forward case of the university bullying him into silence?
On the first day of the preliminary hearing Barrister Ben Kidston for the applicant (Dr Ridd) argued eloquently about how the case was about ‘academic freedom’. He went-on for over an hour moving from the big picture to the detail with respect to specific clauses in a code of conduct and the enterprise agreement, and back again. All the while His Honour and the audience listened intently – no one interrupted. Again yesterday, His Honour cited the poorly worded specific clause which the university has been relying on to silence Dr Ridd, and observed that it was open to two interpretations.
His Honour didn’t mention the Union. The National Tertiary Education Union has an interest in the enterprise agreement and like Dr Ridd, they say that the relevant clause in the agreement shouldn’t be used to silence the employee but rather, amongst other things, that the obligation of confidentiality only applies to the University’s management of the disciplinary process. Any other interpretation means that university academics would be obliged to suffer any disciplinary action by the University (legitimate or otherwise) in silence – they would never be able to publicly defend themselves in the court of public opinion, court proceedings being the only practical option. One wonders if the Union realises the implications to its members.
Yesterday, when His Honour gave his reasons for declining the application by Dr Ridd for an injunction – for his temporary reinstatement as a Professor at James Cook University pending the trial – he didn’t deal with many of the arguments advanced for Dr Ridd e.g. the effect of the clause of the enterprise agreement which states that the code of conduct is not to “detract” from the intellectual freedoms, the interaction of the express right to disagree with the University‘s decisions and processes pursuant to his intellectual freedom and the purported obligation to keep disciplinary proceedings again him confidential, whether a conflict of interest, apprehended bias or actual bias, exists by reason of the university’s commercial relationship with AIMS, GBRMPA and ARC and the effect that this has on the obligation to afford Dr Ridd procedural fairness and natural justice in the determination of the disciplinary complaint (which concerned comments he made about those bodies).
That is not intended to be critical of His Honour. His Honour took a broad brush approach and did not descend into the detail of the arguments and the evidence, as all His Honour was required to do was to ascertain whether Dr Ridd had a prima facie case, and not to decide the case itself.
Yesterday, His Honour found that Dr Ridd had an arguable prima facie case in relation to the alleged breach of the enterprise agreement by JCU and that it took adverse action against him, but that the balance of convenience did not favour his reinstatement pending trial primarily because:
1. an award of damages would be an adequate remedy if Dr Ridd was successful at trial; and
2. the university paid Dr Ridd the equivalent of six month’s pay upon his termination – so he was not presently without income to support himself and (it seems) that a trial would likely occur before the expiration of that six month period; and
3. Dr Ridd had previously turned down an offer of an undertaking by the university to suspend the disciplinary proceedings pending determination of the proceeding. It is important to note that that undertaking would have required Dr Ridd to remain silent about the disciplinary proceedings that had been taken against him by the university.
Of course, in making this determination the Judge was entirely ignoring (as he was entitled to) the very nature of Dr Ridd – a man of integrity who will not be silenced even if costs him his job, his career and results in vicious bullying.
When Christopher Murdoch QC for the respondent (JCU) argued on the first day of the hearing he explained that the University’s core issue was the breaking of confidentiality, in particular Dr Ridd was not allowed to tell anyone that he had been censured. Never mind that he had been censured for daring to speak out against a culture where scientific integrity is perhaps sacrificed for profit.
So, when I blogged about this issue of Peter Ridd being censured and the need for everyone to contribute to his GoFundMe Campaign back in May, I very deliberately emphasised the importance of being able to speak out. The most important thing, I wrote, is to not be silenced.
I was also thinking of the famous Edmund Burke quote: The only thing necessary for the triumph of evil is for good men to do nothing.
Dr Ridd has done something. First, he detailed the scientific facts as an expert on these issues including in the scientific literature. For example, there is his article published in Marine Geology (Volume 346, pages 392-399) in which he explains that the only reason Glenn De’ath found an apparent decline in coral calcification rates was because he didn’t consider the age effect on coral growth. This is just one of many instances when Dr Ridd has detailed how scientists make spurious claims based on a flawed methodology. More recently Dr Ridd has explained the consequences of this in plain English on television.
None of this has made him popular with his colleagues most of whom rely on perceptions of imminent catastrophe at the Great Barrier Reef for their relevance and certainly their funding. Dr Ridd has done what the average Australian would consider to be the right thing. Most importantly he has not remained silent – surely, he will be vindicated at the final trial when all the evidence is heard and all the arguments made and considered.
Give it up James Cook University – Even The Guardian Sympathises with Climate Skeptic Peter Ridd
By Eric Worrall | Watts Up With That? | June 11, 2018
Dr. Willie Soon – the opportunity for James Cook University to salvage what is left of its academic reputation is closing fast.
Peter Ridd’s academic union is backing him, senior Australian politicians have spoken out against James Cook’s heavy handed actions, and now The Guardian is concerned about what Peter Ridd’s dismissal means for academic freedom.
Peter Ridd’s sacking pushes the limit of academic freedom
James Cook University may have damaged its reputation with a heavy-handed approach to the academic with minority views on climate change and the reef.
Gay Alcorn
Tue 5 Jun 2018 11.59 AEST
I hate to say it, but the sacking of professor Peter Ridd by James Cook University does raise issues of academic freedom. Not simple issues, and ones that can be refuted as the university is doing, but ones that matter nonetheless.
…
His trouble started in April 2016 when he received a “formal censure” for “misconduct”. It was a curious incident: the university had got hold of an email that Ridd sent to a news.com.au journalist a few months before. In it, he urged the journalist to look into work Ridd had had done suggesting that photographs released by the Great Barrier Reef Marine Park Authority indicating a big decline in reef health over time were misleading.
Ridd couldn’t help a dig: The photographs are “a dramatic example of how scientific organisations are quite happy to spin a story for their own purposes”. The authority, and the ARC Centre of Excellence for Coral Reef Studies – based at James Cook University –“should check their facts before they spin their story … my guess is that they will both wiggle and squirm because they actually know that these pictures are likely to be telling a misleading story – and they will smell a trap.”
This was enough for the university to censure Ridd on the grounds that he breached the code of conduct by “going to the media in your professional capacity in a way that was not collegial and did not respect the rights of others or uphold professional standards”. It was a warning. Ridd could make public comments but they “must be in a collegial manner that upholds the university and individuals’ respect”.
As a journalist, I find this uncomfortable. He had strong opinions, strongly put, in an area which he had professional interest and expertise. Foolishly, the journalist forwarded the entire email to an unnamed professor, who complained to the university.
…
James Cook University, for all its worries about its reputation, seems to have diminished its own. As the national tertiary education union’s Queensland secretary, Michael McNally put it a few days ago: “All management have done is to feed a right-wing media narrative that universities are conformist and actively suppress heterodox views on topics such as climate change.”
…
For all the university’s sensitivity about its brand and reputation, you have to wonder if it has damaged its own standing with its strident calls for “collegiality” and its repeated insistence that Ridd stay mute.
The other way would be for academics not to complain about Ridd’s impolite turn of phrase, but to reject his arguments, loudly and with evidence. For Australia’s premier reef research institutions to keep doing good work, and keep explaining it to the public, and to treat Ridd as little more than a thorn in their side. And for the university to put up with their troublesome academic and to not be obsessed with process and its own self importance.
As this has dragged on, that was the way that was lost.
James Cook University IS feeding a narrative that universities actively suppress non-conformist views on climate change. The mistreatment of Peter Ridd adds evidence to concerns that other scientists have also been punished for politically inconvenient views.
Frightening scientists into silence by threatening their livelihood every time they say something inconvenient is an attack on science.
I can think of countless advances which only occurred because courageous scientists stood against mainstream thought.
Lives have been saved because of academic courage – one of my heroes Aussie medical scientist Barry Marshall risked his own life to overturn decades of misdiagnosis and misery, by deliberately infecting himself with Helicobacter Pylori to prove ulcers are caused by a bacterial infection.
Peter Ridd’s contribution is no less important.
Farmers in Queensland are threatened with increasingly costly draconian restrictions on farming practices, which are justified as vital to protect the endangered Great Barrier Reef. It is likely some farm businesses won’t survive if those restrictions are tightened further. It is also likely that some farmers in this predicament won’t survive the stress of seeing their businesses destroyed.
If Peter Ridd is right, if the problems with the reef have been exaggerated, then some or even most of these draconian restrictions on farming practices are unnecessary. There is no doubt in my mind that if Peter Ridd is right, his courage will save lives, will contribute to the happiness and wellbeing of countless rural families.
Peter Ridd deserves a fair hearing, not abuse, threat and censure.
George Monbiot: selling the 1% agenda in a Green box

George Monbiot NOT shilling for corporate interests
By Catte | OffGuardian | June 8, 2018
The neoliberals of today specialise in using concepts of concern and inclusiveness as a cover for their frankly fascist agenda. Censorship is being repackaged as “anti-hate”. The destruction of the core idea of “innocent until proven guilty” is being repackaged as protecting (mostly female) victims from their persecutors. Reasonable doubt is being repackaged as “denialism.” Minority opinion is being repackaged as treachery or subversion. Facts that contradict a current state-sponsored agenda are repackaged as “fake news.”
Conformity is being encouraged, presented as a cosy and reassuring “consensus blanket”, under which we can all snuggle together, safe from confusion, doubt or the horrendous experience of having our cherished beliefs called into question. Most journos operating in the mainstream have already opted to crawl in and curl up for the long snooze into intellectual and ethical oblivion, while others, the kapos, are actively herding the remaining doubters inside.
George Monbiot is one of the latter. The last few years have outed this one time supposed anti-establishment figure as nothing more than a fully establishment goon, posturing in the sad tatters of his “dissident Green” cosplay. His performance during the Syria crisis made this too obvious. His sub-intelligent smears on those independent journalists daring to question the narrative made his real allegiances, and limitations, more than clear. His preparedness to brazenly lie and his refusal to debate the people he smeared in an open forum cemented this view.
Monbiot is revealed as the guy the establishment uses to try and lure the Left-Greens out in support of the latest agenda roll-out by the likes of Soros, Gates and the Atlantic Council. He’s booked for the same gigs as Avaaz. His brief, as ever, is to sell fascism – but this time in a Green box.
Today George is busy selling us on veganism.
Now, don’t get me wrong. Veganism is fine. It’s a human choice and it has a place. This is not an attack on veganism, or vegans.
But we need to separate what a thing is from what it’s being used for. Everything, even the best things, can be exploited. And we can’t let loyalty to the thing itself stop us from seeing when its being used for less than good ends.
Veganism is being promoted right now by the usual suspects. There has been a rash of articles in the Guardian and elsewhere about the supposed health and environmental benefits of giving up meat and dairy. Even if we happen to be vegan, we’d be insane not to wonder why. Especially when Monbiot is getting involved.
George is a poster child for the New Wave Vegan. Strange, perhaps, given he’s only a “97% vegan” himself. But let’s just ignore the 3% carnivore, since it’s only road kill. The more important point, anyway, is that George wants us all to think he’s a vegan. Because a salesman has to be seen to use the product he’s promoting. His latest article breaks no new ground on this really. He’s said most of it before, as have others. But still, given the mounting evidence for the political mobilisation of veganism, it’s a good idea to look at what he says.
He starts by offering a binary choice – between the current wasteful and insane industrial farming system and a somewhat poorly defined alternative in which everyone eats a plant-based diet, which he implies without really saying, will put an end to this insanity. He tells us not only will this choice fix the problem of worldwide food shortage (because plant-husbandry produces far more calories per hectare than animal husbandry), but it will also remove the problem of all that unused animal waste currently pouring into rivers and creating massive pollution.
George’s ideal future will also be gratifying for the processed food industry. Because vegans need ready meals!
Unless you can cook well – and many people have neither the skills nor the space – a plant-based diet can be either boring or expensive. We need better and cheaper vegan ready meals and quick and easy meat substitutes
And fake meat grown in a lab!
The big shift will come with the mass production of cultured meat.
George recognises the latter will be a tough sell, but he’s up for giving it a try. An objection to this might be that “artificial meat is disgusting”, says George, but:
If you feel this way, I invite you to look at how your sausages, burgers and chicken nuggets are currently raised, slaughtered and processed. Having worked on an intensive pig farm, I’m more aware than most of what disgusting looks like.
Mmmm… Lab-grown pseudo-meat, pink-dyed and not quite as disgusting as something even worse! Lovely Roundup-saturated veggies [silage] processed into some approximation of the kind of protein humans can digest, and piped into microwavable sachets.
Who knew utopia would end up looking quite so much like – now? Who knew the new way would be just like the old way but with more “progressive” slogans?
George uses twisty self-contradictory arguments to claim one minute that eliminating livestock farming would “be a chance to break our complete dependence on artificial nitrogen”, while in his very next para admitting the exact opposite will in fact be the case.
the transition to plant protein is unlikely to eliminate the global system’s need for artificial fertiliser
Though he throws us a bone in the shape of
the pioneering work of vegan organic growers, using only plant-based composts and importing as little fertility as possible from elsewhere
This is blatant bait and switch. Green or green-sounding proclamations being swapped out for their very opposites with a deftness he hopes will fool us. We may, in some misty future time, not need to rely entirely on synthetic chemicals – but yes, OK, for now we will still be sucking up carcinogens with our lovely all veg diet.
Of course we could just use the animal manure to fertilise our veggies, which would entirely eliminate the need for chemical fertilisers… But let’s not think about that too much. Let’s instead soften that focus and just picture fields full of lovely cruelty-free plants waving in the even lovelier breeze…
In case you haven’t noticed, George’s entire article is hand-waving nonsense predicated on a lie, or a system of lies, and his trademark nifty footwork.
His claim that we need to produce more food is used as a blanket rationale for everything he advocates, but it’s a lie. We don’t need to produce more food. We currently produce more than enough food to feed the world. What we need and don’t have is equitable distribution. And that is because of the stranglehold of the minority interests George is carefully eliding.
His initial binary choice is a lie. We don’t need to choose between intensive animal farming and intensive cereal/veg farming. We have the option of non-intensive farming methods that treat the land, the animals and the crops with respect, and use age-old, sustainable methods to produce chemical-free and healthy food.
His dishonesty is nowhere more apparent than when he tries to elide this simple truth. Look at how he acknowledges the illogicality of unused animal waste
Today, the link between livestock and crops has mostly been broken: crops are grown with industrial chemicals while animal slurry stacks up, unused, in stinking lagoons, wipes out rivers and creates dead zones at sea.
but dodges away from the obvious solution – use the “slurry” to fertilise the land in place of synthetic chemicals – with a weak excuse:
When it is applied to the land, it threatens to accelerate antibiotic resistance.
Notice how he avoids mentioning the fact non-intensively reared animals don’t need to be pumped full of antibiotics in the first place. He even links to the source for sustainable husbandry I cite above, but does so only to dismiss it (without data) as “worse” than anything else on offer, by using, once again, the fake claim about the need to produce more food per hectare:
More damaging still is free-range meat: the environmental impacts of converting grass into flesh, the paper remarks, “are immense under any production method practised today”. This is because so much land is required to produce every grass-fed steak or chop
And adding that it’s also bad for the environment
Those who claim that “regenerative” or “holistic” ranching mimics nature deceive themselves. It relies on fencing, while in nature wild herbivores roam freely, often across vast distances. It excludes or eradicates predators, which are crucial to the healthy functioning of all living systems. It tends to eliminate tree seedlings, ensuring that the complex mosaics of woody vegetation found in many natural systems – essential to support a wide range of wildlife – are absent
You thought Monsanto, GM, monocultures and the ripping up of hedgerows was the problem? Nah. It’s fences. And herbivores eating the grass they’re designed to eat. And implicit in this nonsense of course is the greater nonsense that massive veggie monocultures drowned in pesticides and herbicides, are just teaming with wild life, tree seedlings and predators.
Just as he used frank lies to promote the Soros-backed White Helmets as unsung “heroes”, here, in the fake guise of promoting a healthy, organic, back-to-nature solution to the world’s problems, George is promoting the current power system of Big Ag and Big Food monopoly. Just as Avaaz sells us imperial regime change as grass roots activism, George is selling us industrial farming and denatured food as a return to Eden.
Don’t buy what he’s selling. Don’t surrender your sense of the real to this snake oil salesman. Go vegan if you want – that’s a fine personal choice. But not at the expense of the small producers who are already struggling to survive without the subsidies the big guys get. Don’t vote for some future “meat tax” that will drive them out of business, and penalise the poor, just as Big Ag wants. Don’t buy into this soft focus dreamland where our entire livestock herd disappears bloodlessly and completely from our landscape without being killed or culled, and is somehow better for it. Don’t be whispered into campaigning for a new and self-imposed serfdom, in which 7 billion compliant vegans munch their potage or their shrink-wrapped lab-grown Soylent Green, while the 1% quietly eat grass-fed steak and snigger with duping delight.
Featured Video

Roosevelt’s Partnership with Stalin
or go to
Aletho News Archives – Video-Images
From the Archives
The great ADHD swindle
By Daniel Ken | TCW Defending Freedom | May 20, 2023
Over more than two decades in the classroom I’ve taught thousands of children and teenagers: some were lovely and lots were hard-working. On the other hand, quite a number were disruptive and argumentative, and a number were violently opposed to learning. But I don’t think I’ve taught more than a handful of kids who could be properly described as having the symptoms of ADHD. And that handful could just as easily have had something else wrong with them. Because here’s the thing: despite the fact that the best part of a million children are medicated for the condition, ADHD doesn’t exist.
There’s no definitive medical test for it, experts can’t agree on what it actually means, and most of the symptoms disappear if the child in question has lots of exercise, good diet and, crucially, a set of clear behavioural boundaries, preferably set early in childhood and, for the boys at least, enforced by a stable adult male living at home. … continue
Blog Roll
 Aletho News
- ‘Biased censorship’: Iran deputy FM slams X for stripping him of blue tick
- Hezbollah lawmaker says Israel has 60 days to withdraw from Lebanon
- Iran rules out IAEA inspections of war-damaged nuclear sites
- Israeli regime’s only interest is ‘permanent war,’ Iran’s FM Araghchi says
- Syria, Lebanon, and the limits of power
- How Multipolarity Forced Trump to Capitulate… For Now
- Switzerland confirms US-Iran talks planned for Friday are cancelled
- Iran Beat Back The Greater Israel Project
- Roosevelt’s Partnership with Stalin
- Strategic Ambiguity (If We Must)
- If Americans Knew
- 15 articles a day: The extent of the Israeli army’s media interference
- Greek Orthodox Patriarchate denounces Israeli seizure of church land in Jerusalem
- How Hillel International uses antisemitism training and ‘campus climate’ concerns to attack Palestine solidarity
- Old Iraq war architects rise up against Trump’s Iran deal
- Unmasking Axios, its Israeli ties and agenda
- Israel Is Bleeding Support in the U.S. – and Pouring Tens of Millions Into Trying to Change That
- Israeli army included on UN blacklist for 3rd year over ‘grave violations’ against children
- Trita Parsi on the Iran deal, Israel, and how Iran has been a ‘cash cow’ for AIPAC
- JD Vance speaks truth to Israel: “You can’t just kill your way out of every problem” – Daily Update
- What Ceasefire? Israel Has Now Killed Over 1,000 Palestinians in Gaza Since October
- No Tricks Zone
- New Study: Chile’s Relative Sea Level Was 3.2 Meters Higher Than Today During The Mid-Holocene
- Beyond The Pitch: Why FIFA’s World Cup Is One Of Humanity’s Best Investments
- Climate Alarmists Now Using Natural Phenomena To Support Their Claims
- New Study: Significant CO2 Fluxes From Non-Volcanic Sources Are Largely Neglected In Carbon Budgets
- Women Climate Scientists Being Harassed, Insulted By Skeptics, Claims Berkeley Earth Researcher
- Germany’s Longterm Spring Climate Data Show “No Climate Trend”
- New Study: Solar Photovoltaic, Wind Power Fail To Meet Annual Energy Demands 62% Of The Time
- Germany’s Die Welt: “Too Much Is Too Much” … Green Energies Are Cannabalizing Each Other!
- Germany’s Ecological Holocaust… Once Fairy Tale Forests Getting Cleared For Wind Turbines
- A Grand Solar Minimum Has Arrived…Global Cooling Of At Least 1°C Is Expected By The 2030s, 2040s
