A new website spoofs preposterous claims regarding climate change:
“I’ve started a website with the idea of making it entertaining as well as informative. The website presents global warming predictions that have been made over the past 40 or so years, especially predictions that are either contradictory or alternatively plainly ridiculous and thus amusing.”
Excerpts:
Climate change can also affect the Earth’s spin. Previously, Felix Landerer of NASA’s Jet Propulsion Laboratory in Pasadena, California. and colleagues showed that global warming would cause Earth’s mass to be redistributed towards higher latitudes. Since that pulls mass closer to the planet’s spin axis, it causes the planet to rotate faster – just as an ice skater spins faster when she pulls her arms towards her body. – New Scientist 20 Aug 2009
Belgian scientists have identified a hitherto unsuspected benefit of global warming – more time for all of us. They say increasing levels of carbon dioxide (CO2) in the atmosphere will slow the Earth’s rotation. They used computer models to analyse the effect of adding 1% more CO2 to the atmosphere annually. – BBC News, 12 Feb 2002

February 10, 2015
Posted by aletho |
Deception, Mainstream Media, Warmongering, Science and Pseudo-Science, Timeless or most popular | BBC, NASA, New Scientist |
Leave a comment
The Food and Drug Administration (FDA) routinely fails to report evidence of fraud or misconduct when it inspects the way researchers conduct clinical trials, leaving the public unaware of which research is credible and which isn’t.
Researchers at New York University found that in dozens of published papers where the FDA had uncovered faults in clinical trials, only three ever indicated that violations occurred. In a stem cell trial, for example, all patients were said to have experienced improvement – despite one having a foot amputated.
The New York University study examined 57 clinical trials that received a notice of violation from the FDA for poor record keeping, false information, and poor patient study. Researchers found that findings from those clinical trials were used in 78 published papers – but only in three instances were the faults in the clinical trials mentioned in the papers.
In the other cases, none of the published papers containing data from faulty trials were corrected or retracted.
“These are major things,” Professor Charles Seife, the study’s author, told Reuters. “No one really knows unless you go through these documents that anyone is question the integrity of the trials.”
In one case, an entire clinical trial was considered unreliable by the FDA, but the published paper didn’t mention the violation at all. In another trial, researchers covered up a patient’s death.
Of the 57 published clinical trials, 39 percent had evidence of false information, 25 percent reported adverse events, 61 percent had record keeping problems, and 35 percent failed to protect the safety of the patient or had issues with oversight or informed consent.
“The FDA has repeatedly hidden evidence of scientific fraud not just from the public, but also from its most trusted scientific advisers, even as they were deciding whether or not a new drug should be allowed on the market,” Seife wrote at Slate. “For an agency devoted to protecting the public from bogus medical science, the FDA seems to be spending an awful lot of effort protecting the perpetrators of bogus science from the public.”
Seife said his team could have uncovered even more instances from the 600 clinical trials mentioned in the documents, but most of the documents obtained from the FDA were heavily redacted. “In some cases, you can’t even tell which drug is being tested,” he said.
Every year, the FDA inspects several hundred clinical sites performing biomedical research on human participants and occasionally finds evidence of violations of good clinical practices and misconduct. The study said, however, that the FDA has no systematic method for communicating these findings to the scientific community, and its findings go unremarked in peer-reviewed literature.
In a statement to Reuters, the FDA said it is “committed to increasing the transparency of compliance and enforcement activities with the goal of enhancing the public’s understanding of the FDA’s decision, promoting the accountability of the FDA, and fostering an understanding among regulated industry about the need for consistently safe and high-quality products.”
READ MORE:
US spends most on this drug… and no one knows how it works
GMO potato seeks FDA approval, opponents say safety risks remain
February 10, 2015
Posted by aletho |
Deception, Economics, Science and Pseudo-Science | Corruption, Drugs, Health, Medicine, Science, SciTech, United States, USA |
Leave a comment
In an article at the Grand Forks Herald, Minnesota Public Radio goes all in on climate hysteria – and fails in what is simply terrible science journalism by a public broadcaster.
The fact-checking can start with the opening sentences:
St. Patrick’s Day 2012 was the crowning moment of one of Minnesota’s mildest winters: Jubilant parade spectators wore flip flops, Miss Shamrock beamed in sleeveless, emerald satin, and the beer never tasted so refreshing as temperatures hit 80 degrees.
Three months later, the dazzling sunlight was nowhere to be found when rain sheets pummeled the Duluth area. Muddy torrents of chocolate, fuming floodwaters tore through town, leaving shock and devastation.
Both extremes happened in a Minnesota our descendants never knew. It’s warmer, especially in the winter, and rising global temperatures have stacked the deck in favor of heavier rains.
The hottest temperature during that March 2012 in Duluth was 75 degrees. Not even close to the record of 81 degrees set in 1946.
But, the alarmists may say, St. Patrick’s Day 2012 was on March 17, and we’ve never seen temperatures this high on that date before. Perhaps, but one day in one month in one year doesn’t make a trend. Over the past century, and also since 1970 and during the past three decades, there has not been any sign of a significant trend in maximum temperatures on March 17 for the Duluth area. Same goes with absolute maximum temperatures during March. No significant trends over any of these time frames, and during the last 30 years, the correlation is negative – toward lower extreme maximum temperatures in March.
In the Minneapolis-St. Paul region, the 80 degrees in March 2012 was tied with 1967 as only the fifth highest March extreme maximum temperature on record, behind 1986, 1968, 1910, and 2007. No significant trends in maximum temperatures for March 17, either, and the last three decades have a negative correlation toward lower – not higher – extreme maximum temperatures in this month.
Thus, the problems in this article start early. And they continue.
The growing season in the Twin Cities is several weeks longer than it was even in the 1970s.
This classifies as cherry-picking 101, and it is egregious science journalism. Has there been a statistically significant increase in the growing season for the Twin Cities since the 1970s? Yes. But here is the growing season length dating back to when records began in 1873.

Since records began in the 1870s, there is an overall negative correlation toward a shorter – not longer – growing season in the Twin Cities region. Even with the increase in growing season length since the 1970s, the area is only back up to where it historically was before the 1970s.
Between 1873 and 1969, the area averaged a growing season length of 165 days. The average since 1970 has been 164 days. Some climate change.
Then there are the extreme rains:
In Minnesota and the Midwest generally, 37 percent more rain falls in these big 2.5-inch-plus storms than did 50 years ago, said researcher Ken Kunkel of the National Climatic Data Center in North Carolina. ‘We’ve found that the last decade actually has the largest number of these events since the network began in the late 19th Century.’
There are no significant trends in the number of days per year with 2.5+ inches of precipitation for any of the state’s climate subregions in the National Weather Service database. The Twin Cities and Duluth climate areas have the longest records for this metric, and here are the non-existent trends since the early 1870s.

See a climate crisis? No, because there isn’t one. Next issue.
The 2-inch rains historically have come about every five years in a given place. And then there are the really big storms that bring at least 6 or 7 inches of rain over a huge geographic area, with powerful enough spots within the storm dumping 8 inches or more. These types of storms are occurring more frequently, at least partly because warmer air can hold more water.
Two-inch rains come about every five years in the historic record? No chance. Between 1872 and 1970 for the Duluth region, they came about every 1.5 years (i.e., 0.65 per year on average). Overall from 1872 to 2014, they come about every 1.3 years. For the Twin Cities, the average is 0.93 per year since the 1870s, or one per year. All a far cry from “about every five years.”
As for the 6- to 7-inch megastorms, the Duluth region has never (at least during recorded history) received 6 inches of precipitation in a day. The record is 5.20 inches, set in 1909, followed by 4.14 inches in 2012 and 4.00 inches in 1876, all of which seems to contradict this claim:
The 2012 storm in Duluth was considered a 500-year event. It overwhelmed culverts and took out streets.
In June 2012, Duluth received 4.14 inches over one day, and 7.25 inches over two consecutive days, with no rain on the third day. But back in July 1909, the city received 5.20 inches in one day, 6.68 inches over two consecutive days, and 7.83 inches over three consecutive days. Ergo, storms of this magnitude have happened before since records began in the late 1800s, leading to the question as whether the 2012 event was really a 500-year event, and if such events are really becoming more common.
The Saint Cloud area’s top four record daily rainfalls all came before 1957, and none was more than 5 inches. The Twin Cities received 9.15 inches in a single day during 1987, and the next three daily rainfall maxima occurred in 1977, 1892, and 1903. The International Falls region’s record daily rainfall is only 4.82 inches, set back in 1942. The next highest 24-hour totals are from 1966 and 1898.It is certainly debatable whether extreme rain events are on the rise.
Then come the omnipresent concerns over unpredictability, as if weather or climate were ever predictable:
A third facet of the change in Minnesota’s climate, in addition to more heat and bigger storms, is murkier because it involves scientists asking whether things are in fact getting more variable and unpredictable.
For example, because big rainstorms account for a bigger portion of total rainfall, the state can dry out for weeks without reducing annual precipitation.
Some meteorologists call it ‘flash drought.’ Suddenly, after a wet spring, the spigot turns off. The big May 2012 storm in Duluth gave the St. Louis River its highest-ever discharge crest. But six months later, the river was at drought levels.
Actually, both the Twin Cities and Duluth regions have positive correlations since records began in the 1870s – and statistically significant trends over the past century – toward more days per year with precipitation, not less.
Finally, we have the 2012 storm (which was in June, not May) in Duluth that “gave the St. Louis River its highest-ever discharge crest.” Here is the USGS peak streamflow record for the St. Louis River at Scanlon, just upstream from Duluth:

Yes, 2012 set a record, but look at the peak flow trend since the 1970s: declining with no unusual variability aside from the single data point in 2012. One data point does not make climate change.
And about those “drought levels” in the river six months after the flood – which would mean December 2012 – the flow in the river during December was only the 18th lowest on record (i.e., hardly unusual) and almost threefold higher than the record low December flow set back in 1910. By the way, the trend since records began on the river in 1908 is toward more December flow – not less – so climate change isn’t leading to wintertime “drought” flows on the river, either.
So ends the examination of but one climate change story in a single relatively small newspaper from the American Midwest. There is climate reality, but science journalism by the mainstream media is getting farther away from it.
February 10, 2015
Posted by aletho |
Deception, Mainstream Media, Warmongering, Science and Pseudo-Science | Grand Forks Herald, Minnesota Public Radio, United States |
Leave a comment
. . . They usually mop the floor with the climatistas. That’s one reason why the climate campaign has resorted to rank conformism and outright bullying.
Matt Ridley offered his observations about the state of things in an article in the London Times a few days ago entitled “My Life as A Climate Lukewarmer.”
I am a climate lukewarmer. That means I think recent global warming is real, mostly man-made and will continue but I no longer think it is likely to be dangerous and I think its slow and erratic progress so far is what we should expect in the future. That last year was the warmest yet, in some data sets, but only by a smidgen more than 2005, is precisely in line with such lukewarm thinking.
This view annoys some sceptics who think all climate change is natural or imaginary, but it is even more infuriating to most publicly funded scientists and politicians, who insist climate change is a big risk. My middle-of-the-road position is considered not just wrong, but disgraceful, shameful, verging on scandalous. I am subjected to torrents of online abuse for holding it, very little of it from sceptics.
I was even kept off the shortlist for a part-time, unpaid public-sector appointment in a field unrelated to climate because of having this view, or so the headhunter thought. In the climate debate, paying obeisance to climate scaremongering is about as mandatory for a public appointment, or public funding, as being a Protestant was in 18th-century England.
Kind friends send me news almost weekly of whole blog posts devoted to nothing but analysing my intellectual and personal inadequacies, always in relation to my views on climate. Writing about climate change is a small part of my life but, to judge by some of the stuff that gets written about me, writing about me is a large part of the life of some of the more obsessive climate commentators. It’s all a bit strange.
There’s more; definitely worth reading the whole thing. … continue
February 2, 2015
Posted by aletho |
Full Spectrum Dominance, Science and Pseudo-Science | UK |
Leave a comment

Mr Dunlop, who’s now with the Association for the study of Peak Oil and Gas, says Australia will be one of the hardest hit by a rise in global temperatures. “We’re one of the driest continents on the earth and the effects on Australia will be more severe than elsewhere.” – ABC News, May 2013
Australia’s top intelligence agency believes south-east Asia will be the region worst affected by climate change by 2030, with decreased water flows from the Himalayan glaciers triggering a ‘cascade of economic, social and political consequences’. The dire outlook was provided by the deputy director of the Office of National Assessments, Heather Smith, in a confidential discussion on the national security implications of climate change with US embassy officials. — Sydney Morning Herald, Dec 2010
The effects of climate change will impact more severely on the economy of Papua New Guinea than on any other in the Pacific, according to a new report by the Asian Development Bank. – ABC News, Nov 2013
Research reports that Bangladesh is one of the hardest hit nations by the impacts of climate change. — UK climate4classrooms.org
There seems to be consensus in the developed world that Africa will be the hardest hit or most affected region, due to anthropogenic climate change. – YouLead Collective, a young generation of climate leaders, Nov 2014
Vietnam is likely to be among the countries hardest hit by climate change, mainly through rising sea levels and changes in rainfall and temperatures. – International Food Policy Research Institute, 2010
Norway’s Minister of the Environment and International Development Erik Solheim stated today that “The Small Island Developing States are among the hardest hit by climate change.” — as reported by the Norwegian media, Nov 2011
Maldives’ economy hardest hit by climate change: Asian Development Bank. The Maldives is the most at-risk country in South Asia from climate change impacts, said the report titled ‘Assessing the costs of climate change and adaptation in South Asia.’ – Minivan News, Aug 2014
According to the latest data modelling, climate change is likely to have the strongest impact on Scandinavian countries such as Denmark, Norway and Sweden – planetearthherald.com
Bulgaria, Spain, Portugal, Italy and Greece are the countries that would be worst affected by global warming, according to a European Union report. The EC Joint Research Commission (JRC) report, released on Wednesday, takes into account four significantly sensitive factors: agriculture, river flooding, coastal systems and tourism. — Sofia News Agency, Nov 2009
The economies of southern Europe and the Mediterranean, including Malta, are forecast to suffer the most adverse effects of climate change, according to a new report drawn up by the European Environment Agency. — Primo-europe.eu, July 2010
Climate change is faster and more severe in the Arctic than in most of the rest of the world. The Arctic is warming at a rate of almost twice the global average — panda.org
China’s Poor Farmers Hit Hardest by Climate Change. Declan Conway, a University of East Anglia researcher who has studied climate change’s affect on China’s farmers, told Reuters that people in remote communities in China’s poorer regions are particularly exposed to climate hazards. — Circle Of Blue, Dec 2012
Report: Middle East, African Countries to Be Hardest Hit by Climate Change — CommonDreams, Dec 2012
January 31, 2015
Posted by aletho |
Deception, Mainstream Media, Warmongering, Science and Pseudo-Science |
Leave a comment
I would like to address this statement made by the President:
Well, I’m not a scientist, either. But you know what — I know a lot of really good scientists at NASA, and NOAA, and at our major universities. The best scientists in the world are all telling us that our activities are changing the climate, and if we do not act forcefully, we’ll continue to see rising oceans, longer, hotter heat waves, dangerous droughts and floods, and massive disruptions that can trigger greater migration, conflict, and hunger around the globe. The Pentagon says that climate change poses immediate risks to our national security. We should act like it.
And also his tweet:
97% of climate scientists agree: Climate change is real. Denial from Congress is dangerous.
The problem is that President Obama is listening to scientists that are either playing politics with their expertise, or responding to a political mandate from the administration (probably a combination of both). Not just administrators in government labs (e.g. Schmidt, Karl), but think of the scientist networks of John Holdren and John Podesta: to me the scariest one one is Mann to Romm to Podesta.
So what is wrong with President Obama’s statements as cited above?
- His statement about humans having exacerbated extreme weather events is not supported by the IPCC
- The Pentagon is confusing climate change with extreme weather (see above)
- ‘Climate change is real’ is almost a tautology; climate has always changed and always will, independently of anything humans do.
- His tweet about ‘97%’ is based on an erroneous and discredited paper [link]
- As for ‘Denial from Congress is dangerous’, I doubt that anyone in Congress denies that climate changes. The issue of ‘dangerous’ is a hypothetical, and relates to values (not science).
And speaking of the ‘deniers’ in Congress, did anyone spot any errors in the actual science from Senator Inhofe’s rebuttal?
The apparent ‘contract’ between Obama and his administrators to play politics with climate science seems to be a recipe for anti science and premature policies with negative economic consequences that have little to no impact on the climate.
Maybe some day, in a future administration, we can have a grown up conversation about climate change (natural and human caused), the potential risks, and a broad range of policy responses.
January 21, 2015
Posted by aletho |
Corruption, Deception, Progressive Hypocrite, Science and Pseudo-Science | Obama, United States |
Leave a comment
This week has been an education–reviewing the work of Naomi Oreskes, Anderegg, Prall et al, John Cook et al and Stephan Lewandowsky.
Short version–some people who were (mostly) not scientists and certainly don’t know how to do research properly conducted a series of studies that had foregone conclusions supporting their position on climate policy. For Prall, Cook and Lewandowsky the foregone nature of the conclusions was explicit–they wrote on various websites that they were conducting the studies with a predetermined end. For Oreskes it was implicit, but easy to see, as she structured her research carefully, not to show the breadth of opinion on climate change, but rather to conceal it.
I guess I should address Stephan’s potential concerns first–no, I don’t see a conspiracy in the work I’ve reviewed, even though there is a web of mutual citations in the work involved and collaboration between some of the principals.
Oreskes, the ‘purest’ scientist in the bunch, wrote the original paper (Beyond the Ivory Tower) and it served as a template (and was cited as such) for those who came after.
Her ‘original sin’ was one that has destroyed a lot of research studies unintentionally–sample bias. The literature search on which her work was based omitted relevant studies from skeptics. I say that was intentional, but that’s just my opinion. It was a trivial exercise to find numerous studies by skeptics that would have drastically changed her results. My opinion is she knew those studies were there and carefully crafted a keyword search string that would exclude them.
Anderegg, Prall et al were much sloppier and in addition to sample bias made numerous errors in data collection, analysis and other methodological choices. Their study is garbage. The same is true for Cook et al–their 97% consensus claim is utter nonsense. And when Lewandowsky tried to do in primary research what the others did with secondary research, he only introduced a new class of childish mistakes. I have worked in market research for more than 20 years and I’ve made my share of mistakes. I recognize their mistakes. The difference between these amateurs and professionals is that when professionals make mistakes they admit them and work to correct them. This crew just doubled down on their claims and hoped that nobody would dig very deeply. But when I use words like garbage and nonsense, I am not exaggerating. The quality of work that went into these studies is so bad that if anything I’m understating things.
After Climategate, the actions of those supporting the consensus have been increasingly frantic and in most cases, inept. When the marketing departments of NGOs create flawed iconography of polar bears under threat, videos of people blowing up skeptics and trash treasured archeological sites, it’s easy to dismiss these as the mistaken work of people who have adopted a religion, rather than scientific findings.
But when trash is put before the scientific community as the alleged results of research conducted within the norms of science, it is something else, something much worse. It not only damages the effort to understand how our climate is changing and what we should do about it. It damages science.
Numerous studies have shown a very real tendency for studies to be irreplicable and unreproducible. Fraud has been found as well as mistakes.
Climate change is important and will affect the lives of our children. But science is more important and trashing science to win a policy fight over climate change has the potential to do more damage to the human race than any changes we cause to the climate.
January 17, 2015
Posted by aletho |
Corruption, Deception, Science and Pseudo-Science |
Leave a comment
So, was 2014 the ‘warmest year’? Drum roll . . .
NASA has just issued its press release NASA, NOAA find 2014 hottest year in record. Nothing in the way of technical details, such as warmest by ‘how much’ and ‘is it statistically significant?’
NYTimes ‘breaking news’: 2014 was hottest year on record surpassing 2010 interviews Gavin Schmidt:
With the continued heating of the atmosphere and the surface of the ocean, 1998 is now being surpassed every four or five years, with 2014 being the first time that has happened in a year featuring no real El Niño pattern. Gavin A. Schmidt, head of NASA’s Goddard Institute for Space Studies in Manhattan, said the next time a strong El Niño occurs, it is likely to blow away all temperature records.
No word yet from HadCRUT4, I heard we can expect their report next week. Somewhere I read that Cowtan and Way did NOT expect 2014 to be warmest in their data set?
Berkeley Earth has published a nice analysis of their 2014 data [link]. Summary of their main findings:
1. The global surface temperature average for 2014 was nominally the warmest since the global instrumental record began in 1850; however, within the margin of’error, it’s tied with 2005 and 2010 and so we can’t be certain it set a new record.
2. For the land, 2014 was nominally the 4th warmest year since 1753
3. For the sea, 2014 was the warmest year on record since 1850
4. For the contiguous United States, 2014 ranked nominally as the 38th warmest year on record since 1850.
Some other statements of interest:
Several European countries set all time records for high annual average temperature, as did the continent of Europe as a whole
The margin of uncertainty we achieved was remarkably small (0.05C with 95% confidence).This was achieved, in part, by the inclusion of data from over 30,000 temperature stations, and by the use of optimized statistical methods. Even so, the highest year could not be distinguished. That is, of course, an indication that the Earth’s average temperature for the last decade has changed very little.
Meanwhile, the ‘warmest year’ is noticeably missing in the satellite data sets of lower atmospheric temperatures. Roy Spencer reports that 2014 was third warmest year since 1979, but just barely.
Roz Pidcock has penned an article Explainer: How do scientists measure global temperature, that discusses differences among the analyses.
Capitol Weather Gang has reactions from 20 scientists [link], including a few sensible ones (such as moi).
El Nino?
One of the key aspects of the hype about the ‘warmest year in 2014′ was that 2014 was not even an El Nino year. Well, there has been a great deal of discussion about this issue on the Tropical ListServ. Here is what I have taken away from that discussion:
A global circulation response pattern to Pacific convection with many similarities to El Niño has in fact been present since at least June. Convection to the east of New Guinea is influencing zonal winds in the upper troposphere across the Pacific and Atlantic, looking similar to an El Nino circulation response.
So, is it El Niño? Not quite, according to some conventional indices, but a broader physical definition might be needed to capture the different flavors of El Nino. A number of scientists are calling for modernizing the ENSO identification system. So I’m not sure how this event might eventually be identified, but for many practical purposes (i.e. weather forecasting), this event is behaving in many ways like an El Nino.
What does this mean for interpreting the ‘almost warmest year’? Well not much; I think it is erroneous to infer that ‘it must be AGW since 2014 wasn’t even an El Nino year’ is useful reasoning here.
That said, there is definitely some unusual events on the North Pacific, including extreme warm anomalies in the mid-high latitudes, and positive value of the PDO.
Bottom line
Berkeley Earth sums it up well with this statement:
That is, of course, an indication that the Earth’s average temperature for the last decade has changed very little.
The key issue remains the growing discrepancy between the climate model projections and the observations: 2014 just made the discrepancy larger.
Speculation about ‘warmest year’ and end of ‘pause’ implies a near term prediction of surface temperatures – that they will be warmer. I’ve made my projection – global surface temperatures will remain mostly flat for at least another decade. However, I’m not willing to place much $$ on that bet, since I suspect that Mother Nature will manage to surprise us. (I will be particularly surprised if the rate of warming in the next decade is at the levels expected by the IPCC.)
Senator Ted Cruz
Senator Ted Cruz is (R-Texas) was just named to be the chairman of the Subcommittee on Space, Science, and Competitiveness. The folks at Slate are not happy: Yup, a Climate Change Denier Will Oversee NASA. What Could Possibly Go Wrong? They are particularly up in arms over this statement from Ted Cruz:
The last 15 years, there has been no recorded warming. Contrary to all the theories that—that they are expounding, there should have been warming over the last 15 years. It hasn’t happened.
Here is what Slate has to say:
This is, to put it mildly, what comes out of the south end of a north-facing bull. Yes, the Earth has warmed over the past 15 years, and the science is incredibly, unequivocally clear about that. Anyone making this claim either doesn’t know what they’re talking about, or is trying to sell you something (or, to be more accurate, has been bought).
So, what is wrong with Cruz’s statement? Well, assuming that by ‘recorded warming’, he means the satellite-derived lower atmospheric surface temperatures his statement is absolutely correct. If he is referring to globally averaged surface temperatures since 2000, there is only a very small amount of warming; this small amount of warming is indeed contrary to the theory of AGW.
Without going into details here, I refer you to my previous post and my invited presentation given at the American Physical Society: Causes and Implications of the Pause.
Bottom line: There is nothing irrational or particularly incorrect about Senator Cruz’s statement. Phil Plait (Bad Astronomer) who wrote the Slate piece made more incorrect statements than did Cruz.
I just spotted this article from Science2.0 re Cruz and NASA, worth reading [link]
January 16, 2015
Posted by aletho |
Science and Pseudo-Science |
Leave a comment
The year 2014 was another year of futility in the fight against climate change. Climatists redoubled efforts to convince citizens that urgent action is needed to stop dangerous global warming. But the gap between public warnings and actual events produced an endless stream of climate irony.
January began with a frosty bang as an arctic air mass descended on the central United States, following a similar event in December. What was once called a cold snap is now ominously christened a “polar vortex.” Record-low daily temperatures were recorded from Minnesota to Boston, along with all-time seasonal snowfalls in many cities.
In a White House video released on January 8, John Holdren, chief science advisor to President Obama, made the paradoxical statement, “But a growing body of evidence suggests that the kind of extreme cold being experienced by much of the United States as we speak is a pattern that we can expect to see with increasing frequency as global warming continues.”
Also in January, passengers of the research ship Akademik Shokalskiy were rescued after the ship was locked in ice for 10 days near the antarctic coast. The expedition lead by professor Chris Turney had intended to study how weather patterns near Antarctica were changing due to man-made global warming.
On February 16, during a presentation in Indonesia, Secretary of State John Kerry stated that climate change was “perhaps the world’s most fearsome weapon of mass destruction.” Only two days later, protestors set fire to Kiev, the capital of Ukraine, leading to the resignation of President Viktor Yanukovych. In March, Russia seized the Crimea. In July, Malaysia Airlines Flight 17 was shot down over eastern Ukraine, and political unrest continues today. In the Middle East, slaughter of innocent civilians and beheading of western captives became a growing trend. Man-made climate casualties seem remarkably scarce in comparison.
In March, the Intergovernmental Panel on Climate Change of the United Nations released Climate Change 2014: Impacts, Adaptation, and Vulnerability, part of its Fifth Assessment Report. The report said that man-made climate change would reduce world agricultural output. Lead author Dr. Mark Howden stated, “There’s increasing evidence that climate change is also impacting on agriculture, particularly on some of the cereal crops such as wheat and maize. The negative impacts are greater and quicker than we previously thought.”
Meanwhile, farmers continued to ignore the warnings of the IPCC. According to the US Department of Agriculture, world agricultural production set all-time records for all three major cereal crops in 2014, with rice output up 1.1 percent, wheat up 11.2 percent, and corn up a whopping 14.0 percent over 2013.
The Obama administration continued its attack on coal-fired power plants, which provide about 40 percent of US electricity. In June, the EPA proposed new restrictions on carbon emissions that would make it virtually impossible to build a new coal-fired plant in the US. At the same time, more than 1,200 new coal-fired plants are planned across the world, with two-thirds to be built in India and China.
In his 2007 Noble Prize acceptance speech, former Vice President Al Gore warned that the arctic ice could be gone in “as little as seven years.” But arctic sea ice rebounded in 2014 and antarctic sea ice has been growing for decades. According to the University of Illinois, satellites measured global sea ice area at above the 30-year average at the end of 2014.
In September, the United Nations held a climate summit in New York City to urge the world to conserve energy and reduce emissions. Spokesman Leonardo DiCaprio stated, “This disaster has grown beyond the choices that individuals make.” Mr. DiCaprio neglected to mention his frequent flights on carbon-emitting private jets or his ownership of the world’s fifth largest yacht, purchased from a Middle East oil tycoon.
In October, climate skeptics reported the eighteenth straight year of flat global temperatures. Satellite data shows no temperature increase since 1997. The “pause” in global warming is now old enough to vote or to serve in the military.
Hurricanes and tornadoes are favored events for generating alarming climate headlines, but US weather events were few in 2014. US tornadic activity was below average and the lack of strong hurricanes continued. No Category 3 or stronger hurricane has made US landfall for more than eight years, the longest period since records began in 1900.
The last half of 2014 witnessed a steep drop in world petroleum prices from over $100 per barrel to under $60 per barrel. Hydraulic fracturing and horizontal drilling, technologies perfected by US geologists and petroleum engineers over the last two decades, produced an explosion in US oil production and triggered the fall in world prices.
But the concurrent drop in US gasoline prices to two dollars per gallon is not welcomed by man-made global warming believers. Former Energy Secretary Stephen Chu said in 2008, “So we have to figure out how to boost the price of gasoline to the levels in Europe.” English journalist George Monbiot has lamented, “We were wrong about peak oil: there’s enough in the ground to deep-fry the planet.”
With all the climate fun in 2014, what will 2015 hold?
Steve Goreham is Executive Director of the Climate Science Coalition of America and author of the book The Mad, Mad, Mad World of Climatism: Mankind and Climate Change Mania.Chi
December 30, 2014
Posted by aletho |
Deception, Economics, Science and Pseudo-Science | United Nations, United States |
Leave a comment
There Are More Oil Seeps Than All The Tankers On Earth
Deep underwater, and deeper underground, scientists see surprising hints that gas and oil deposits can be replenished, filling up again, sometimes rapidly.
Although it sounds too good to be true, increasing evidence from the Gulf of Mexico suggests that some old oil fields are being refilled by petroleum surging up from deep below, scientists report. That may mean that current estimates of oil and gas abundance are far too low.
Recent measurements in a major oil field show “that the fluids were changing over time; that very light oil and gas were being injected from below, even as the producing [oil pumping] was going on,” said chemical oceanographer Mahlon “Chuck” Kennicutt. “They are refilling as we speak. But whether this is a worldwide phenomenon, we don’t know.”
Also not known, Kennicutt said, is whether the injection of new oil from deeper strata is of any economic significance, whether there will be enough to be exploitable. The discovery was unexpected, and it is still “somewhat controversial” within the oil industry.
Kennicutt, a faculty member at Texas A&M University, said it is now clear that gas and oil are coming into the known reservoirs very rapidly in terms of geologic time. The inflow of new gas, and some oil, has been detectable in as little as three to 10 years. In the past, it was not suspected that oil fields can refill because it was assumed the oil formed in place, or nearby, rather than far below.
According to marine geologist Harry Roberts, at Louisiana State University, “petroleum geologists don’t accept it as a general phenomenon because it doesn’t happen in most reservoirs. But in this case, it does seem to be happening. You have a very leaky fault system that does allow it to migrate in. It’s directly connected to an oil and gas generating system at great depth.”
What the scientists suspect is that very old petroleum — formed tens of millions of years ago — has continued migrating up into reservoirs that oil companies have been exploiting for years. But no one had expected that depleted oil fields might refill themselves.
Now, if it is found that gas and oil are coming up in significant amounts, and if the same is occurring in oil fields around the globe, then a lot more fuel than anyone expected could become available eventually. It hints that the world may not, in fact, be running out of petroleum.
“No one has been more astonished by the potential implications of our work than myself,” said analytic chemist Jean Whelan, at the Woods Hole Oceanographic Institution, in Massachusetts. “There already appears to be a large body of evidence consistent with … oil and gas generation and migration on very short time scales in many areas globally,” she wrote in the journal Sea Technology.
“Almost equally surprising,” she added, is that “there seem to be no compelling arguments refuting the existence of these rapid, dynamic migration processes.”
The first sketchy evidence of this emerged in 1984, when Kennicutt and colleagues from Texas A&M University were in the Gulf of Mexico trying to understand a phenomenon called “seeps,” areas on the seafloor where sometimes large amounts of oil and gas escape through natural fissures.
“Our first discovery was with trawls. We knew it was an area of massive seepage, and we expected that the oil seeps would poison everything around” the site. But they found just the opposite.
“On the first trawl, we brought up over two tons of stuff. We had a tough time getting the nets back on board because they were so full” of very odd-looking sea floor creatures, Kennicutt said. “They were long straw-like things that turned out to be tube worms.
“The clams were the first thing I noticed,” he added. “They were pretty big, like the size of your hand, and it was obvious they had red blood inside, which is unusual. And these long tubes — 3, 4 and 5 feet long — we didn’t know what they were, but they started bleeding red fluid, too. We didn’t know what to make of it.”
The biologists they consulted did know what to make of it. “The experts immediately recognized them as chemo-synthetic communities,” creatures that get their energy from hydrocarbons — oil and gas — rather than from ordinary foods. So these animals are very much like, but still different from, recently discovered creatures living near very hot seafloor vent sites in the Pacific, Atlantic and other oceans.
The difference, Kennicutt said, is that the animals living around cold seeps live on methane and oil, while the creatures growing near hot water vents exploit sulfur compounds in the hot water.
The discovery of abundant life where scientists expected a deserted seafloor also suggested that the seeps are a long-duration phenomenon. Indeed, the clams are thought to be about 100 years old, and the tube worms may live as long as 600 years, or more, Kennicutt said.
The surprises kept pouring in as the researchers explored further and in more detail using research submarines. In some areas, the methane-metabolizing organisms even build up structures that resemble coral reefs.
It has long been known by geologists and oil industry workers that seeps exist. In Southern California, for example, there are seeps near Santa Barbara, at a geologic feature called Coal Oil Point. And, Roberts said, it’s clear that “the Gulf of Mexico leaks like a sieve. You can’t take a submarine dive without running into an oil or gas seep. And on a calm day, you can’t take a boat ride without seeing gigantic oil slicks” on the sea surface.
Roberts added that natural seepage in places like the Gulf of Mexico “far exceeds anything that gets spilled” by oil tankers and other sources.
“The results of this have been a big surprise for me,” said Whelan. “I never would have expected that the gas is moving up so quickly and what a huge effect it has on the whole system.”
Although the oil industry hasn’t shown great enthusiasm for the idea — arguing that the upward migration is too slow and too uncommon to do much good — the search for new oil and gas supplies already has been affected, Whelan and Kennicutt said. Now, companies scan the sea surface for signs of oil slicks that might point to new deposits.
“People are using airplane surveys for the slicks and are doing water column fluorescence measurements looking for the oil,” Whelan said. “They’re looking for the sources of the seeps and trying to hook that into the seismic evidence” normally used in searching for buried oil.
Similar research on known oil basins in the North Sea is also under way, and “that oil is very interesting. There are absolutely marvelous pictures of coral reefs which formed from seepage [of gas] from North Sea reservoirs,” Whelan said.
Analysis of the ancient oil that seems to be coming up from deep below in the Gulf of Mexico suggests that the flow of new oil “is coming from deeper, hotter formations” and is not simply a lateral inflow from the old deposits that surround existing oil fields, she said. The chemical composition of the migrating oil also indicates it is being driven upward and is being altered by highly pressurized gases squeezing up from below.
This upwelling phenomenon, Whelan noted, fits into a classic analysis of the world’s oil and gas done years ago by geochemist-geologist John Hunt. He suggested that less than 1 percent of the oil that is generated at depth ever makes it into exploitable reservoirs. About 40 percent of the oil and gas remains hidden, spread out in the tiny pores and fissures of deep sedimentary rock formations.
And “the remaining 60 percent,” Whelan said, “leaks upward and out of the sediment” via the numerous seeps that occur globally.
Also, the idea that dynamic migration of oil and gas is occurring implies that new supplies “are not only charging some reservoirs at the present time, but that a huge fraction of total oil and gas must be episodically or continuously bypassing reservoirs completely and seeping from surface sediments on a relatively large scale,” Whelan explained.
So far, measurements involving biological and geological analysis, plus satellite images, “show widespread and pervasive leakage over the entire northern slope of the Gulf of Mexico,” she added.
“For example, Ian MacDonald at Texas A&M has published some remarkable satellite photographs of oil slicks which go for miles in the Gulf of Mexico in areas where no oil production is occurring.” Before this research in oil basins began, she added, “changes in reservoired oils were not suspected, so no reliable data exists on how widespread the phenomenon might be in the Gulf Coast or elsewhere.”
The researchers, especially the Texas team, have been working on this subject for almost 15 years in collaboration with oil industry experts and various university scientists. Their first focus was on the zone called South Eugene Island block 330, which is 150 miles south of New Orleans. It is known as one of the most productive oil and gas fields in the world. The block lies in water more than 300 feet deep.
As a test, the researchers attempted to drill down into a known fault zone that was thought to be a natural conduit for new petroleum. The drilling was paid for by the U.S. Department of Energy.
Whelan recalled that as the drill dug deeper and deeper, the project seemed to be succeeding, but then it abruptly ended in failure. “We were able to produce only a small amount of oil before the fault closed, like a giant straw,” probably because reducing the pressure there allowed the fissure to collapse.
In addition to the drilling effort and the inspection of seeps, Whelan and her colleagues reported that three-dimensional seismic profiles of the underground reservoirs commonly show giant gas plumes coming from depth and disrupting sediments all the way to the surface.
This also shows that in an area west of the South Eugene Island area, a giant gas plume originates from beneath salt about 15,000 feet down and then disrupts the sediment layers all the way to the surface. The surface expression of this plume is very large — about 1,500 feet in diameter. One surprise, Whelan said, was that the gas plume seems to exist outside of faults, the ground fractures, which at present are the main targets of oil exploration.
It is suspected that the process of upward migration of petroleum is driven by natural gas that is being continually produced both by deeply buried bacteria and from oil being broken down in the deeper, hotter layers of sediment. The pressures and heat at great depth are thought to be increasing because the ground is sinking — subsiding — as a result of new sediments piling up on top. The site is part of the huge delta formed over thousands of years by the southward flow of the massive Mississippi River. Like other major deltas, the Mississippi’s outflow structure is continually being built from sands, muds and silts washed off the continent.
Analysis of the oil being driven into the reservoirs suggests they were created during the so-called Jurassic and Early Cretaceous periods (100 million to 150 million years ago), even before the existing basin itself was formed. This means the source rock is buried and remains invisible to seismic imaging beneath layers of salt.
In studying so-called biomarkers in the oil, Whelan said, it was concluded that the oil is closely related to other very old oils, implying that it “was probably generated very early and then remained trapped at depth until recently.” And, she added, other analyses “show that this oil must have remained trapped at depths and temperatures much greater than those of the present-day producing reservoirs.”
At great depth, where the heat and pressure are high enough, she explained, methane is produced by oil being “cracked,” and production of gas “is able to cause sufficient pressure to periodically open the fracture system and allow upward fluid flow of methane, with entrapment of oil in its path.”
Copyright © 2002, Newsday, Inc.
December 28, 2014
Posted by aletho |
Economics, Malthusian Ideology, Phony Scarcity, Science and Pseudo-Science, Timeless or most popular |
Leave a comment
Politically correct climate change orthodoxy has completely destroyed our ability to think rationally about the environment. – Richard Tol
Richard Tol as an essay at The American Interest entitled Hot Stuff, Cold Logic. This is probably the most sensible overview on climate policy that I’ve encountered. I encourage you to read the entire article, here are some excerpts:
Change, after all, can be for the better or the worse, and at any rate it is inevitable; there has never been a lengthy period of climate stasis.
Just as there is no logical or scientific basis for thinking that climate change is new, there is no self-evident reason to assume that the climate of the past is “better” than the climate of the future.
Others argue that the impacts of climate change are largely unknown but may be catastrophic. The precautionary principle thus enjoins that we should work hard, if not do our utmost, to avoid even the slim possibility of catastrophe. This logic works fine for one-sided risks. Climate policy is about balancing risks, and there are risks to climate policies as well as risks caused by climate change. So there is a cost to human well-being in constraining fossil fuel use.
What this means is that, instead of assuming the worst, we should study the impacts of climate change and seek to balance them against the negative effects of climate policy. It is especially important to maintain an objective attitude toward the tradeoff between possible dangers and the costs of policy, because estimating the impacts of climate change has proven to be remarkably hard.
Besides, the faint signal of past climate change is drowned out by all the other things that have changed. Many things are changing, often much faster than the climate, and in ways that confound all unifactoral explanations potentially relevant to policy.
Studies, assessed by the Intergovernmental Panel on Climate Change in its latest report, that have used such methods find that the initial, net impacts of climate change are small (about 1 percent of income) and may even be positive.
In the long run, however, negative impacts may surge ahead of positive ones. The long-run impacts are what matter most for policy. The climate responds only slowly to changes in emissions, and emissions respond only slowly to changes in policy. The climate of the next few decades is therefore largely beyond our control. It is only in the longer term that our choices affect climate change, and by then its impacts are likely to be negative on net. This implies that climate change is an economic problem, and that if economics could be rid of politics, greenhouse gas emissions should be taxed.
The question is therefore not whether there is an economic case for climate policy; it’s how much emission reduction can be justified at given losses to social welfare. To answer that question, we need to understand the size of the impacts of climate change. The current evidence, weak and incomplete as it may be, as summarized by the Intergovernmental Panel on Climate Change, suggests that a century worth of climate change is about as bad as losing a year of economic growth.
But even if we take this into account [worst case scenario], a century of climate change is not worse than losing a decade of growth. So if, as Bjørn Lomborg has been at pains to point out, we “spend” the equivalent of a decade of growth or more trying to mitigate climate change, we will not have spent wisely.
Climate change is a problem, but at least as an economics problem, it is certainly not the biggest problem humankind faces.
The best course of action is to slowly but surely move away from fossil fuels. Many disagree with this plan of action, of course, calling for a rapid retirement of fossil fuel use. Economically, their justification rests on assuming that we should care more about the future than we do in contexts other than climate change, that we should care more about small risks than we do, or that we should care more about poor people than we do.
If our resources were unlimited, we could do all things worthwhile. With a limited budget, we should focus on those investments with the greatest return.
These three examples—of coastal protection, agriculture, and malaria—show that development and vulnerability to climate change are closely intertwined. Slowing economic growth to reduce climate change may therefore do more harm than good. Concentrating the reduction of greenhouse gas emissions in rich countries will not solve the climate problem. And slower growth in rich countries means less export from and investment in poor countries.
A fifth of official development aid is now diverted to climate policy. Money that used to be spent on strengthening the rule of law, better education for girls, and improved health care, for instance, is now used to plug methane leaks and destroy hydrofluorocarbons.
In sum, while climate change is a problem that must be tackled, we should not lose our sense of proportion or advocate solutions that would do more harm than good. Unfortunately, common sense is sometimes hard to find in the climate debate. Desmond Tutu recently compared climate change to apartheid. Climate experts Michael Mann and Daniel Kammen compared it to the “gathering storm” of Nazism in Europe before World War II. That sort of nonsense just gets in the way of a rational discussion about what climate policy we should pursue, and how vigorously we should pursue it.
JC comments
The American Interest is one of my favorite sources for policy analysis, and I follow Walter Russell Mead on Twitter.
Richard Tol is IMO one of the most interesting thinkers on the economics of climate change.
For my previous posts on climate change policy, see the policy tag.
December 27, 2014
Posted by aletho |
Economics, Science and Pseudo-Science |
Leave a comment
“…startling data omission that he told me: “eclipses even the so-called climategate event.””
Willis Eschenbach tips me to a story by Marita Noon, titled:
What if Obama’s climate change policies are based on pHraud?
I’ve reproduced portions of it here, with a link to the full article. The graph with ALL the data is compelling.
“Ocean acidification” (OA) is receiving growing attention. While someone who doesn’t follow climate change science might think OA is a stomach condition resulting from eating bad seafood, OA is claimed to be a phenomenon that will destroy ocean life—all due to mankind’s use of fossil fuels. It is a foundational theory upon which the global warming/climate change narrative is built.
The science and engineering website Quest, recently posted: “Since the Industrial Revolution in the late 1700s, we have been mining and burning coal, oil and natural gas for energy and transportation. These processes release carbon dioxide (CO2) into the atmosphere. It is well established that the rising level of CO2 in our atmosphere is a major cause of global warming. However, the increase in CO2 is also causing changes to the chemistry of the ocean. The ocean absorbs some of the excess atmospheric CO2, which causes what scientists call ocean acidification. And ocean acidification could have major impacts on marine life.”
Within the Quest text is a link to a chart by Dr. Richard A. Feely, who is a senior scientist with the Pacific Marine Environmental Laboratory (PMEL)—which is part of the National Oceanic and Atmospheric Administration (NOAA). Feely’s climate-crisis views are widely used to support the narrative.

Feely’s four-page report: Carbon Dioxide and Our Ocean Legacy, offered on the NOAA website, contains a similar chart. This chart, titled “Historical & Projected pH & Dissolved Co2,” begins at 1850. Feely testified before Congress in 2010—using the same data that shows a decline in seawater pH (making it more acidic) that appears to coincide with increasing atmospheric carbon dioxide.
…
The December edition of the scientific journal Nature Climate Change features commentary titled: “Lessons learned from ocean acidification research.”
However, an inquisitive graduate student presented me with a very different “lesson” on OA research.
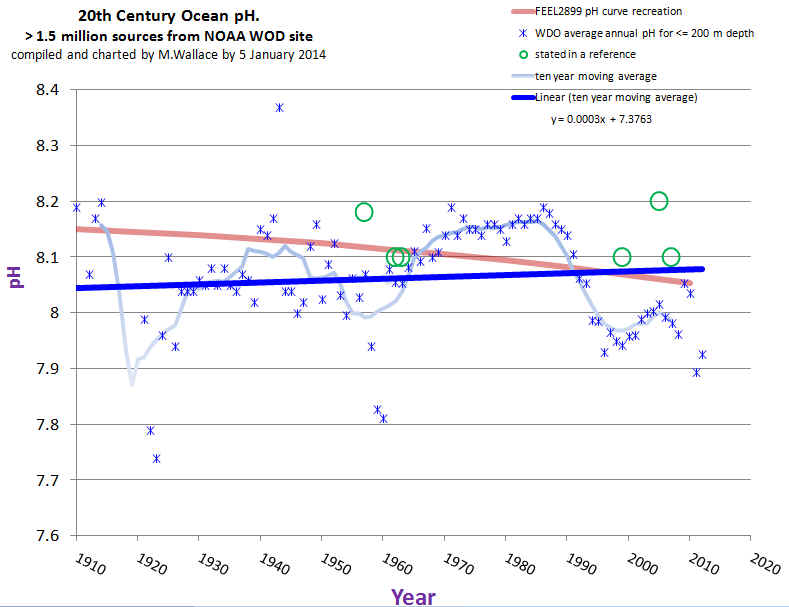
Mike Wallace is a hydrologist with nearly 30 years’ experience, who is now working on his Ph.D. in nanogeosciences at the University of New Mexico. In the course of his studies, he uncovered a startling data omission that he told me: “eclipses even the so-called climategate event.” Feely’s work is based on computer models that don’t line up with real-world data—which Feely acknowledged in email communications with Wallace (which I have read). And, as Wallace determined, there is real world data. Feely, and his coauthor Dr. Christopher L. Sabine, PMEL Director, omitted 80 years of data, which incorporate more than 2 million records of ocean pH levels.
Feely’s chart, first mentioned, begins in 1988—which is surprising as instrumental ocean pH data has been measured for more than 100 years since the invention of the glass electrode pH (GEPH) meter. As a hydrologist, Wallace was aware of GEPH’s history and found it odd that the Feely/Sabine work omitted it. He went to the source. The NOAA paper with the chart beginning in 1850 lists Dave Bard, with Pew Charitable Trust, as the contact.
Wallace sent Bard an email: “I’m looking in fact for the source references for the red curve in their plot which was labeled ‘Historical & Projected pH & Dissolved Co2.’ This plot is at the top of the second page. It covers the period of my interest.” Bard responded and suggested that Wallace communicate with Feely and Sabine—which he did over a period of several months. Wallace asked again for the “time series data (NOT MODELING) of ocean pH for 20th century.” Sabine responded by saying that it was inappropriate for Wallace to question their “motives or quality of our science,” adding that if he continued in this manner, “you will not last long in your career.” He then included a few links to websites that Wallace, after spending hours reviewing them, called “blind alleys.” Sabine concludes the email with: “I hope you will refrain from contacting me again.” But communications did continue for several more exchanges.
In an effort to obtain access to the records Feely/Sabine didn’t want to provide, Wallace filed a Freedom of Information Act (FOIA) request.
In a May 25, 2013 email, Wallace offers some statements, which he asks Feely/Sabine to confirm:
“…it is possible that Dr. Sabine WAS partially responsive to my request. That could only be possible however, if only data from 1989 and later was used to develop the 20th century portion of the subject curve.”
“…it’s possible that Dr. Feely also WAS partially responsive to my request. Yet again, this could not be possible unless the measurement data used to define 20th century ocean pH for their curve, came exclusively from 1989 and later (thereby omitting 80 previous years of ocean pH 20th century measurement data, which is the very data I’m hoping to find).”
Sabine writes: “Your statements in italics are essentially correct.” He adds: “The rest of the curve you are trying to reproduce is from a modeling study that Dr. Feely has already provided and referenced in the publication.”
In his last email exchange, Wallace offers to close out the FOIA because the email string “clarified that your subject paper (and especially the ‘History’ segment of the associated time series pH curve) did not rely upon either data or other contemporary representations for global ocean pH over the period of time between the first decade of 1900 (when the pH metric was first devised, and ocean pH values likely were first instrumentally measured and recorded) through and up to just before 1988.” Wallace received no reply, but the FOIA was closed in July 2013 with a “no document found” response.
Interestingly, in this same general timeframe, NOAA reissued its World Ocean Database. Wallace was then able to extract the instrumental records he sought and turned the GEPH data into a meaningful time series chart, which reveals that the oceans are not acidifying. (For another day, Wallace found that the levels coincide with the Pacific Decadal Oscillation.) As Wallace emphasized: “there is no global acidification trend.”

Regarding the chart in question, Wallace concludes: “Ocean acidification may seem like a minor issue to some, but besides being wrong, it is a crucial leg to the entire narrative of ‘human-influenced climate change.’ By urging our leaders in science and policy to finally disclose and correct these omissions, you will be helping to bring honesty, transparency, and accountability back where it is most sorely needed.”
“In whose professional world,” Wallace asks, “is it acceptable to omit the majority of the data and also to not disclose the omission to any other soul or Congressional body?”
Full story here: http://www.cfact.org/2014/12/22/what-if-obamas-climate-change-policies-are-based-on-phraud/
There’s a petition: http://www.ipetitions.com/petition/restore-the-worlds-ocean-ph-measurements
UPDATE:
WUWT reader Peter Gadiel writes:
After reading of the critique of Sabine’s exclusion of the historical data on ocean acidification I emailed him. I thought his response might be of interest to you at WUWT. He says the earlier data is not of “sufficient quality.”
My question to him:
As a taxpayer who is helping to pay your salary I’d like to know why you are refusing to include all the data on ocean acidification that is available.
Sabine’s response:
Chris Sabine – NOAA Federal
12:31 AM (11 hours ago)
As a public servant that must stick to the rigor of the scientific method and only present data that is of sufficient quality to address the question, I am obliged to report the best evaluation of ocean chemistry changes available. This is what you pay me to do and I am working very hard to give you the best value for your tax dollar every day. I hope you are having a good holiday season.
The question that immediately comes to mind is:
Who determined that the directly measured ocean pH data was not of “sufficient quality” and if it wasn’t, why then did NOAA make the data available on their website as part of other ocean data in their World Ocean Database without a caveat?
My search on NOAA’s NODC database for ocean pH data showed plenty of data and no caveats on use… continue
December 24, 2014
Posted by aletho |
Deception, Science and Pseudo-Science, Timeless or most popular | United States |
Leave a comment