UK Intelligence to Fight Anti-Vaccine Propaganda Spread by State Actors, British Media Reports

Anti-vaccine demonstrators in Edinburgh © Sputnik / Jason Dunn
By Tim Korso – Sputnik – 09.11.2020
A UK intelligence unit, known as the Government Communications Headquarters (GCHQ), has been authorised to conduct cyber operations to tackle the spread of anti-vaccine propaganda online, The Times reported citing an anonymous government source. According to the newspaper, the government increasingly views anti-vaxxers as a new priority because of the upcoming registration of domestically-developed vaccines against the coronavirus.
Apart from GCHQ, a secretive UK Army unit within the 77th Brigade specialising in information warfare will be taking part in the efforts “to quash rumours about misinformation” related to the COVID-19 vaccines, General Sir Nick Carter confirmed to The Times.
The newspaper’s source claims that GCHQ will be using the same toolkit it utilised to combat Daesh and its propaganda and recruitment efforts. The toolkit includes ways of taking down undesired content and conducting cyber attacks against the cyberactors behind it, for example by encrypting the perpetrators’ computer data, The Times added.
“GCHQ has been told to take out anti-vaxxers online and on social media. There are ways they have used to monitor and disrupt terrorist propaganda”, the anonymous source claimed.
However, GCHQ will not be able to use its tools against everyone online because its authority only extends to dealing with [alleged] state cyber actors and the content created by them, the newspaper reported citing another anonymous government source.
Russia as Main target for UK Intelligence Cyber Operations?
The British newspaper claims Russia will be the GCHQ’s prime target, citing its own investigation into the country’s alleged ties to the surge of internet memes questioning the safety of the vaccine developed by Oxford University in concert with AstraZeneca. The said investigation was based on a trove of documents and images provided by an anonymous source, who claimed to be part of an alleged propaganda effort purportedly seeking to hurt the image of the British vaccine. The Times, however, admitted in its article that it could not directly link the alleged social media campaign, targeting only the UK vaccine, with the Kremlin.
According to the newspaper, the alleged campaign against the AstraZeneca/Oxford vaccine started after the head of the Russian Direct Investment Fund (RDIF) that developed Sputnik V, Kirill Dmitriev, called the UK-developed medicine a “monkey vaccine” on several occasions. Dmitriev referred to the vaccine’s usage of a monkey virus as a vector to deliver the COVID-19 material needed to form immunity. He did not directly call the drug dangerous or ineffective, but noted that the use of human adenoviruses was more reliable, as their influence on the human body is better understood.
Dmitriev’s use of the term “monkey vaccine” prompted the emergence of numerous internet memes, baselessly alleging that the British drug would be turning recipients into monkey-like creatures or otherwise negatively affecting patients’ health. The head of RDIF later denounced the use of his words to besmirch the UK-developed vaccine, but defended his concerns over the possibility of its long-term side effects.
U.S. to be Subject to UN “Climate Conciliation Commission” if Re-Joins Paris Climate Pact
By Chris Horner | Government Accountability and Oversight
Paris Climate ‘Accord’ FOIA Case: State Dept. Releases, Withholds Parts of Memo to Sec. John Kerry Requesting Authority to Sign Paris Agreement
It appears possible that, come January, the United States will rejoin the 2015 Paris climate agreement, committing to adopt the “Green New Deal” agenda (now rebranded for political purposes as “Net Zero”). This will not be accomplished by Senate ratification, but by the ‘pen and a phone’ approach first used by President Obama to claim U.S. “ratification” of what is on its face and by its history a treaty, requiring approval instead by a two-thirds Senate vote.
A document released last week by the State Department, in Freedom of Information Act litigation by the transparency group Energy Policy Advocates, includes a reminder of one consequence of this for America, should it occur: claiming to “re-join” the Paris climate treaty will immediately subject U.S. energy policy — and thereby economic and to some extent trade policy — to a UN “climate conciliation commission”.
Already, as the United Kingdom has shown, developed nations’ courts can be expected to cite the Paris climate treaty in blocking infrastructure development. The UK’s Court of Appeal ruled earlier this year that Heathrow Airport cannot be expanded because that would violate the UK’s ‘net zero’ commitment under Paris.
Then, Canada offered a reminder how progressive politicians will raise taxes in the name of complying with Paris: In Ottawa, “The parliamentary budget officer says the federal carbon tax would have to rise over the coming years if the country is to meet emission-reduction targets under the Paris climate accord.”
Now we are reminded that the U.S. can also expect a forum for antagonistic nations to bring their complaints about U.S. policy and claims of non-compliance with Paris’s required “Net Zero” agenda for resolution.
This might be one of the reasons that avoiding a Senate vote on Paris was a key objective of the Obama administration, which stated in August 2015 before there ever was even Paris text, that it would not be a “treaty”. This was the lesson learned from the U.S. Senate’s refusal to consider the 1997 Kyoto treaty: If the Senate votes on it, its details would be debated, and defeated.
That objective of an end-run around the U.S. Constitution’s process was shared by European nations: the French climate change ambassador to the U.N. and President of the Paris COP, Laurence Tubiana and Laurent Fabius, respectively, both openly admitted.
Yet, those same countries treated Paris as a treaty for their own ratification purposes. This cavalier approach to the Constitution in the Obama years makes it easy to forget the U.S. supposedly has the more stringent system for joining international entanglements.
Instead, the Obama team showed what one Senate Foreign Relations Committee lawyer decried as a “disturbing contempt for the Senate’s constitutional rights and responsibilities” by circumventing its constitutional treaty role on Paris. Unfortunately, the institution shrunk from a constitutional fight, and all parties spoke as if calling Paris an “accord” instead carried weight — though the the Kyoto Protocol was alternately called the “Kyoto Accord” and, yes, was still a treaty.
This brings us to the newly released (in part) memo — “Request for Authority to Sign and Join the Paris Agreement, Adopted under the 1992 UN Framework Convention on Climate Change” [UNFCCC] — reaffirming that Paris is the result of “a 2011 negotiating mandate (the “Durban Platform”)”. The Durban “mandate” was to “adopt…a protocol, another legal instrument or an agreed outcome with legal force at the twenty-first session of the Conference of the Parties and for it to come into effect and be implemented from 2020”.
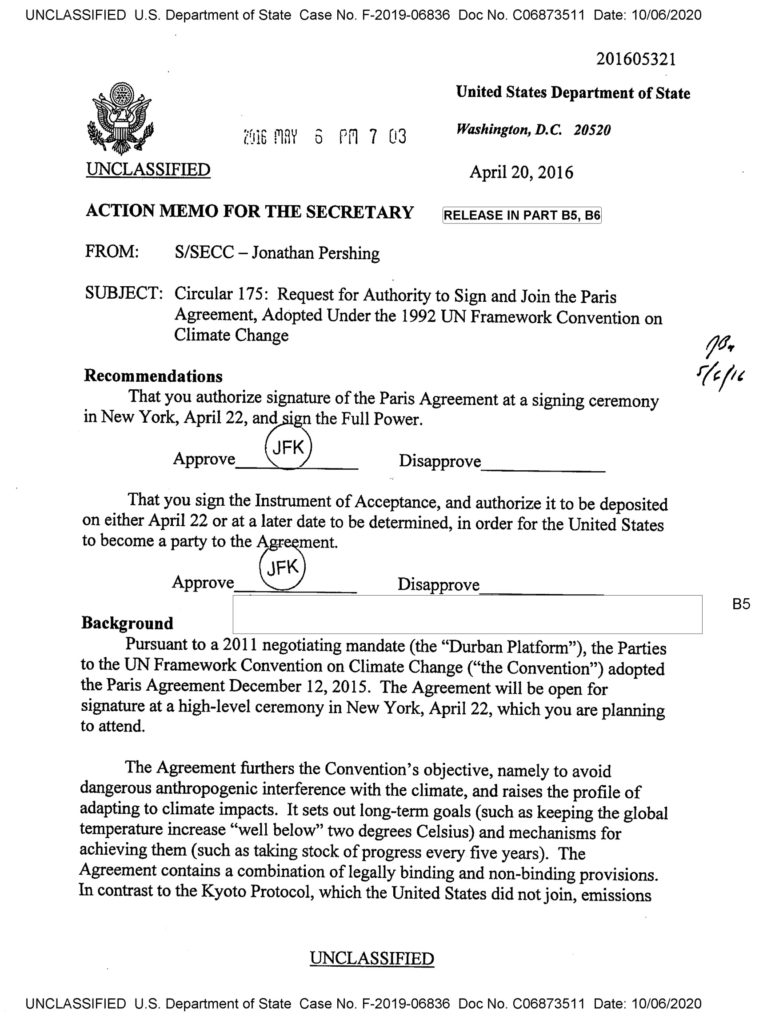
That of course is Paris, the crushing provisions of which are found in Article 4, emission reduction promises. Art. 4.3 requires that the U.S. revisit and tighten its reduction promises every five years. That would cleverly make this the climate treaty…sorry, “accord”… to end all climate treaties. It commits the U.S. to ever greater “climate” policy restrictions, every five years, in perpetuity.
Pull this off and there will never be the threat again of facing the tyranny of the Constitution’s requirement of popular approval.
Political rhetoric aside, nothing in Paris’s terms says this provision is legally binding, but no that one over there isn’t. Instead, Paris was merely sold to and promoted by much of the press with the claim that Paris contains “a mix of legally binding and not legally binding provisions”.
As we have seen already in the UK/Heathrow Airport case, that did not last, as it was not intended to. Lawyers and courts have already begun to see to something of which Americans should be reminded, including that you can have promises of massive infrastructure spending, or you can have the Paris climate pact, but you can’t have them both.
And it won’t just be courts. Recall, first, that the Paris agreement as originally circulated contained a climate tribunal, or court. This was dropped after being noticed outside of polite circles. Nonetheless, the recently released if still heavily redacted memo reminds us that U.S. compliance with the legally binding here but maybe not over there Paris obligations is subject to the terms of that 1992 agreement, ratified by the U.S. Senate on the condition that it was and remained non-binding (again, stated nowhere in its terms).
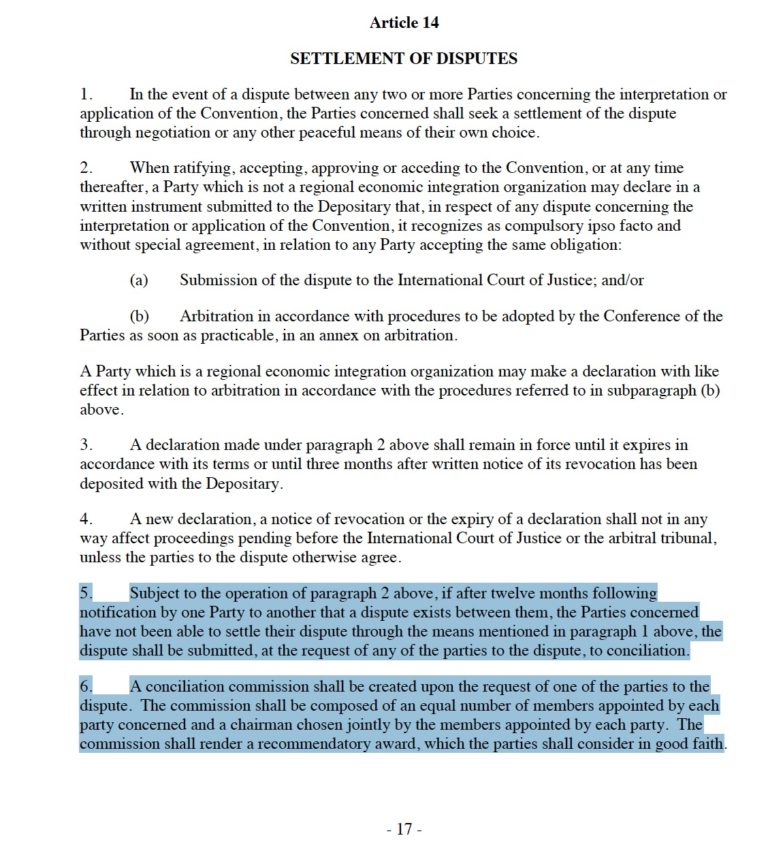
UNFCCC declares, in Art. 14, “Settlement of Dispute”, that:
“5. … if after twelve months following notification by one Party to another that a dispute exists between them, the Parties concerned have not been able to settle their dispute through the means mentioned in paragraph 1 above, the dispute shall be submitted, at the request of any of the parties to the dispute, to conciliation.
6. A conciliation commission shall be created upon the request of one of the parties to the
dispute. The commission shall be composed of an equal number of members appointed by each party concerned and a chairman chosen jointly by the members appointed by each party. The commission shall render a recommendatory award, which the parties shall consider in good faith.”
This language governs U.S. compliance with the Paris climate “accord”. It is not open to dispute that any U.S. president who claims to “re-join” the Paris climate treaty will subject US energy policy — and thereby the U.S. economy — to a UN climate “conciliation commission”.
Paris requires, and mandates the U.S. revisit and tighten “Green New Deal”-style policies every five years. This is among the many reasons why the Paris climate agreement is a treaty, and also why it never would have been ratified. However, very soon, Americans may nonetheless be subject to its long-envisioned climate court.
Why it is right to question the orthodox Covid-19 narrative
The authors of ‘Welcome to Covidworld’ defend their stance
By Matthew Ratcliffe and Ian James Kidd | The Critic | November 6, 2020
In a reply to our piece “Welcome to Covidworld”, Ben Bramble engages in precisely the sort of thinking that we raised concerns about. He suggests that we are mistaken in comparing harms done by lockdowns and other measures to harms caused by the virus. Instead, we ought to have weighed up the costs of lockdowns against what would have happened without them.
Bramble’s case hinges on a counterfactual claim: in the absence of lockdowns, the virus would have inflicted much more harm than it has done. The cost of not locking down would, he says, have been “mind-bogglingly great”.
What could be wrong with Bramble’s claim? First of all, his use of the term “lockdown” is insufficiently discerning. Lockdown is not a simple, straightforward policy measure that took the same form in every country. There are, for instance, important differences between early and late lockdowns. Australia and New Zealand both locked down early and suppressed the virus.
Setting aside the issue of whether or not the actions taken by these countries are morally justifiable, it remains to be seen whether or not this is a success story. If a highly effective vaccine is not forthcoming, both countries will face the painful options of cutting themselves off from the rest of the world indefinitely, having strict lockdowns whenever the virus reappears, or eventually succumbing to the virus, none of which amount to success.
However, the current UK situation is very different. Given where we are now, nobody is claiming that this second lockdown or any future UK lockdowns will be able to suppress the virus here. It is too well established for that. Rather, the stated aims have been to buy us some time until a vaccine arrives and, most recently, to ensure that the NHS is not overwhelmed. In evaluating the effectiveness and appropriateness of such policy measures, it will not do to make sweeping claims about the effectiveness of lockdowns in general. When considering interventions so extreme and destructive, we need to proceed more carefully.
Bramble simply accepts that lockdowns in general work. He does not specify exactly what it would be for a late lockdown to work, when the goal is no longer complete suppression. Presumably, the relevant criteria will include reducing hospitalizations and deaths due to Covid-19, during the lockdown and in the longer term as well. But where is the evidence that lockdowns generally have this effect? Bramble doesn’t provide any. Maybe he thinks it’s just obvious that they achieve this, but it really isn’t.
A strict lockdown in Peru is associated with one of the highest Covid-19 death tolls in the world (currently recorded as 1,047 people per 1 million of the population). Other countries that have resorted to exceptionally long and strict lockdowns, such as Argentina, have also fared badly. One could, of course, run Bramble’s counterfactual here: it would have been even worse for these countries had they not locked down. But where is the evidence for that? Indeed, what would even count as evidence?
It would be intellectually and morally unacceptable to make the pro-lockdown position unfalsifiable by always insisting on the following: (1) where cases drop after a lockdown was introduced, it must be the lockdown that achieved this; (2) where cases rise after a lockdown was introduced, it would certainly have been even worse without the lockdown; (3) if other countries, such as Sweden, adopt less extreme approaches than us and fare better or at least no worse, this must be due to other differences between the two countries – the Swedish strategy would never have worked here.
So, how do we go about evaluating the effectiveness of lockdowns? Where is the evidence that the virus ultimately causes far more deaths in the absence of extreme social restrictions? Where are those countries that followed a different course from countries like the UK (which locked down, but did not suppress the virus) and now have higher death tolls than us? By simply assuming that his counterfactual claim is true, Bramble illustrates our worry that lockdowns risk becoming an unfalsifiable article of faith. In fact, he even asserts that “the science on this is beyond question”. Is it really? If so, all the disease modelers who have made dire predictions concerning the current UK situation will be delighted to hear that their work will be forever immune from critique, even if it turns out that their models have little bearing on reality. And, in any case, none of them would endorse Bramble’s exaggerated claim that, without a lockdown, there would have been “many millions of deaths” in countries such as the UK.
In fact, much about the behaviour of this virus remains unclear, including how the infection rate is influenced by growing immunity within a population. There is no single, homogeneous entity called “the science”. Rather, there are many different and often conflicting perspectives, theories, and claims. Furthermore, this is a complicated, fast-changing situation that impacts on all aspects of human society. Relevant expertise thus encompasses a wide range of academic disciplines and areas of practice. Philosophers should not simply defer to “the experts”; they also have plenty of relevant expertise themselves.
What we do know is that lockdowns are immensely damaging in so many ways. This second UK lockdown will further disrupt the social and emotional development of our children, cause a substantial rise in severe mental health problems, force many elderly people to live out the final weeks and perhaps months of their lives in loneliness and misery, exacerbate and prolong the pain of bereavement by depriving people of interpersonal and social interactions that shape and regulate grief, destroy livelihoods and risk mass unemployment, increase regional social and economic inequalities, reduce the life-opportunities of young people while saddling them with an ever-growing mountain of debt to pay off, suspend much of what gives our lives meaning, deprive people of countless precious, irreplaceable life-moments, and cause deaths due to the numerous resulting impacts on people’s health.
However, the true extent of certain harms, such as the long-term effects of sustained lockdown measures on children’s development, may not become fully clear for some time.
Others have similarly warned that policy makers are paying insufficient attention to these growing costs. For instance, an open letter by psychologists, which appeared on 1 November, spells out the widespread and damaging psychological effects of continuing restrictions, including the harms done to children. Similarly, an article published in the British Medical Journal on 2 November raises the concern that the “collateral damage” caused by public health interventions has “yet to be considered systematically”. Others have drawn attention to the global costs of national lockdowns. For instance, the charity Oxfam has stated that, by the end of this year, over 12,000 people could be starving to death every day due the global impact of national-level responses to Covid-19.
Bramble observes that the orthodox view has in fact been subjected to critical scrutiny. But the problem is that – in the UK, at least – alternative perspectives have had little influence on the processes of recommending, making, and implementing policy decisions. And we worry that this may be partly because of blinkered and inflexible attitudes that are widely held. People are often very quick to dismiss or express moral disapproval of dissenting voices. However, those who confidently endorse lockdowns with an air of moral authority also need to acknowledge the full extent of the harms these measures have caused, are causing, and are likely to cause. Furthermore, explicit and sufficiently specific criteria should be supplied for determining the effectiveness of any proposed lockdown, accompanied by convincing evidence to show that it is very likely to achieve its intended effects.
Instead of pursuing such a path, Bramble speculates that our own concerns originate in cognitive impairments caused by our distressing experiences of lockdown. This is the kind of response that motivated our earlier account of “Covidworld”, a simplified, virus-centric reality where various norms of reason, scientific enquiry, and moral conduct have ceased to apply.
Copyright © Locomotive 6960 Limited 2020
COVID testing: We’ve been duped
By A. Castellitto | American Thinker | November 4, 2020
Lost in this whole pandemic hysteria are some key considerations that when carefully analyzed place the whole COVID-19 narrative in a highly questionable light. The gatekeepers of information dissemination are manufacturing consent at an alarming rate, but their fatigue is setting in, and their masks are falling off. What better, albeit unlikely, source to go for some much needed illumination than the New York Times ?
During a considerably quieter time, back in 2007, the New York Times featured a very interesting exposé on molecular diagnostic testing — specifically, the inadequacy of the polymerase chain reaction (PCR) test in achieving reliable results. The most significant concern highlighted in the Times report is how molecular tests, most notably the PCR, are highly sensitive and prone to false positives. At the center of the controversy was a potential outbreak in a hospital in New Hampshire that proved to be nothing more than “ordinary respiratory diseases like the common cold.” Unfortunately, the results wrought by the PCR told a different story.
Thankfully, a faux epidemic was avoided but not before thousands of workers were furloughed and given antibiotics and ultimately a vaccine, and hospital beds (including some in intensive care) were taken out of commission. Eight months later, what was thought to be an epidemic was deemed a non-malicious hoax. The culprit? According to “epidemiologists and infectious disease specialists … too much faith in a quick and highly sensitive molecular test … led them astray.” At the time, such tests were “coming into increasing use” as maybe “the only way to get a quick answer in diagnosing diseases like … SARS, and deciding whether an epidemic is under way.”
Nevertheless, today, the PCR test is considered the gold standard of molecular diagnostics, most notably in the diagnosis of COVID-19. However, a closer analysis reveals that the PCR has actually been pretty spotty and that false positives abound. Thankfully, the New York Times is once again on the case.
“Your Coronavirus Test Is Positive; Maybe It Shouldn’t Be,” according to NYT reporter Apoorva Mandavilli. Essentially, positive results are getting tossed around way too frequently. Rather, they should probably be reserved for individuals with “greater viral load.” So how have they’ve been doing it all this time you ask?
“The PCR test amplifies genetic matter from the virus in cycles; the fewer cycles required, the greater the amount of virus, or viral load, in the sample … the more likely the patient is to be contagious.”
Unfortunately, the “cycle threshold” has been ramped up. What happens when it’s ramped up? Basically, “huge numbers of people who may be carrying relatively insignificant amounts of the virus” are deemed infected. However, the severity of the infection is never quantified, which essentially amounts to a false positive. Their level of contagion is essentially nil.
How are they determining the cycle threshold? If I didn’t suspect that it was based on maximizing the amount of “cases,” I would find the determination pretty arbitrary. More than a few of the professionals on record for Times report appear pretty perplexed on this vital detail which is essentially driving “clinical diagnostics, for public health and policy decision-making.” Considering all that’s at stake and everything that hinges on positive vs negative case tallies, it’s outrageous that these tests would be tweaked in a way that would inflate the positive rate totals and percentages. According to one virologist, “any test with a cycle threshold above 35 is too sensitive.” She went on to to say, “I’m shocked that people would think that 40 could represent a positive.”
Personally, I think the science is just about settled on COVID-19. The conclusion? We’ve been duped!
How to Scare and Deceive without Lying: JPL Cries Wolf about Polar Glacial Melt
By E. Calvin Beisner | Watts Up With That? | November 6, 2020
Yesterday NASA’s Jet Propulsion Laboratory published “The Anatomy of Glacial Ice Loss.” For the most part it’s an interesting, though not particularly revolutionary, discussion of the various forces that add to and subtract from glacial ice. Nothing wrong with that.
But its authors took the opportunity to insert a poison pill, a little bit of fearmongering, in a video caption:

Did you catch that little trick? “Combined, the two regions also contain enough ice, that if it were to melt all at once, would raise sea levels by nearly 215 feet ….”
Well, yes, but at what rate is the ice from the two regions melting, and at what rate can we, with any confidence, predict they’ll continue to melt, and over what period of time?
There is absolutely no chance of their melting “all at once”—barring, I suppose, Earth’s collision with some enormous asteroid that sends Earth careening into the Sun!
So, how fast is the ice melting?
For Greenland, about 0.1% of its ice mass per decade—1 percent per century.
For Antarctica, about 0.0045% per decade—1% in 2,200 years.
Combined, those contribute to sea-level rise of about 1 mm per year, i.e., 3.94 inches per century.
So, if the actual rate is about 3.94 inches (0.3283 foot) per century, how long would it take to raise sea level by 215 feet? The answer: 215 ft. / 0.3283 ft. per century = 654.889 centuries, or 65,488.9 years.
To be fair, glacial melt from Greenland and Antarctica isn’t the only contributor to sea-level rise. Thermal expansion and other factors also contribute, and some estimates put annual sea-level rise at around 11.81 inches per century, or about 3 times the rate I posited above.
So, let’s redo the calculations. How long, at that rate, would it take to raise sea level by 215 feet? A mere 21,829 years.
Now tell me, if JPL had made that clear, would anyone have taken seriously its saying that this makes “the study and understanding of [the melt in the two glacial regions] … crucial to our near-term adaptability,” or even to “our long term survival”?
No doubt the study is interesting. But it’s certainly not “crucial to our near-term adaptability” or “our long-term survival.”
Is there any reason to think humanity couldn’t survive a 215-foot rise in sea level spread over 21,,829 years, let alone 65,000? And if we define “near-term” as, say, 100 years, or 500, is there any reason to think our “adaptability” would be seriously threatened by 11.81 inches of sea-level rise in a century, let alone 3.94 inches? Or by 4.92 feet in five centuries, let alone 1.64 feet?
And for that matter, what reason have we to think this rate of glacial melt will continue that long into the future? We’re in the midst of a pleasant interglacial period now, but in terms of ice-age cycles, we’re due for the onset of another before long (perhaps in the next few centuries to a millennium?).
E. Calvin Beisner, Ph.D., is Founder, President, and National Spokesman of The Cornwall Alliance for the Stewardship of Creation.
Pulmonary Specialist discusses health risks of wearing masks & the lies surrounding Covid-19
The Last American Vagabond | November 3, 2020
Joining me today is a Dr. Sterling Simpson MD, a double boarded pulmonary specialist here to discuss his dissenting views on numerous topics of paramount importance, each of which we have discussed at length here at The Last American Vagabond, and all surrounding the COVID-19 scandal. His professional opinions, despite being deemed “controversial,” are currently supported by countless experts and medical professionals around the world. My objective today as the host of this interview is to give you an opportunity to listen to these medical opinions that the entirety of MSM are actively hiding from you, and which you have every right to hear. As always, listen, think, and come to your own conclusions.
Want to send a check to support TLAV, or just words of encouragement?
Dr. Simpson’s Book: https://www.amazon.com/Dr-Eyes-Wide-Open-blind/dp/B08JF2DGJ1
https://ise.media/search/plandemic-/
https://lbry.tv/@TLAVagabond:5/dr-andrew-kaufman-interview-the-covid-19:b
https://www.fda.gov/media/134922/download
https://pubmed.ncbi.nlm.nih.gov/31992387/
https://www.thelastamericanvagabond.com/wp-content/uploads/2020/10/COVID-not-isolated.png
https://www.thelastamericanvagabond.com/wp-content/uploads/2020/10/COVID-not-isolated-2.png


5 NIH studies from 2004-2020 all finding verifiable health effects from wearing a face mask, including scientifically verified reduction is blood oxygen level:
https://pubmed.ncbi.nlm.nih.gov/29395560/
https://pubmed.ncbi.nlm.nih.gov/32590322/
https://pubmed.ncbi.nlm.nih.gov/15340662/
https://pubmed.ncbi.nlm.nih.gov/26579222/
https://pubmed.ncbi.nlm.nih.gov/31159777/
Cloth Mask Study
https://www.ncbi.nlm.nih.gov/pmc/articles/PMC4420971/
Other Mask Studies:
https://medrxiv.org/content/10.1101/2020.04.01.20049528v1…
https://medrxiv.org/content/10.1101/2020.03.30.20047217v2…
https://nejm.org/doi/full/10.1056/NEJMp2006372…
https://jamanetwork.com/journals/jama/fullarticle/2749214…
https://cmaj.ca/content/188/8/567…
https://ncbi.nlm.nih.gov/pmc/articles/PMC5779801/…
https://pubmed.ncbi.nlm.nih.gov/19216002/
https://aaqr.org/articles/aaqr-13-06-oa-0201.pdf…
https://ncbi.nlm.nih.gov/pmc/articles/PMC4420971/…
https://academic.oup.com/cid/article/65/11/1934/4068747…
https://jstage.jst.go.jp/article/bio/23/2/23_61/_pdf/-char/en…
https://link.springer.com/article/10.1007/BF01658736…
https://journalofhospitalinfection.com/article/0195-6701(91)90148-2/pdf…
https://ncbi.nlm.nih.gov/pmc/articles/PMC2493952/pdf/annrcse01509-0009.pdf
https://cidrap.umn.edu/news-perspective/2020/04/commentary-masks-all-covid-19-not-based-sound-data…
https://nap.edu/read/25776/chapter/1#6…
https://wwwnc.cdc.gov/eid/article/26/5/19-0994_article…
https://academic.oup.com/annweh/article/54/7/789/202744…
https://ncbi.nlm.nih.gov/pmc/articles/PMC6599448/…
https://acpjournals.org/doi/10.7326/M20-1342
Support The Last American Vagabond by Subscribing here:
http://www.feedblitz.com/f/?Sub=906867
The Last American Vagabond Links:
Minds: https://www.minds.com/TLAVagabond
YouTube: https://www.youtube.com/channel/UCdLXk-XLylNh0QxgXAceHmg
Bitchute: https://www.bitchute.com/channel/24yVcta8zEjY/
DLive: https://dlive.tv/TLAVagabond
LBRY/Odysee: https://odysee.com/@TLAVagabond:5
Rumble: https://rumble.com/user/TheLastAmericanVagabond
Rokfin: https://www.rokfin.com/TLAVagabond
Brighteon: https://www.real.video/channel/tlavagabond
Facebook: https://www.facebook.com/TheLastAmericanVagabond/
Twitter: https://twitter.com/TLAVagabond
Memo: https://memo.cash/profile/1Np4Z2d25RSsQi99gKhf2cd5CAwN57jk13
MeWe: https://mewe.com/profile/5bcfb5d2a5f4e5420d7d5a2f
SoMee: https://somee.social/profile/the-last-american-vagabond/timeline
PocketNet: https://pocketnet.app/author?address=PG1Qm7azCwHwbpUtW2Pudumjg4cQNKwksQ&ref=PG1Qm7azCwHwbpUtW2Pudumjg4cQNKwksQ&report=shares
Flote: https://flote.app/LastAmericanVagabond
Thinkspot: https://www.thinkspot.com/authors/dashboard?post_type=contributors_i_follow&#moveup
Parler: https://parler.com/profile/TLAVagabond/posts
3speak: https://3speak.co/user/tlavagabond
“Copyright Disclaimer Under Section 107 of the Copyright Act 1976, allowance is made for “fair use” for purposes such as criticism, comment, news reporting, teaching, scholarship, and research. Fair use is a use permitted by copyright statute that might otherwise be infringing. Non-profit, educational or personal use tips the balance in favor of fair use.”
Sorry, Google and World Bank, but Middle Eastern Crops Keep Thriving

By H. Sterling Burnett | ClimateRealism | November 4, 2020
Google News today is promoting articles (see the Google-promoted PhysOrg article here, for example) about a speculative World Bank “study” claiming climate change is threatening crop production in the Middle East. The World Bank study is full of speculation but short on facts. Real-world data show crop yields per acre and total crop production are consistently and dramatically rising in each of the Middle East countries examined by the World Bank study.
In its study, titled “Water in the Balance,” the World Bank says, “[w]hile information about water scarcity at present and in the future is available there is little knowledge of what this increasing scarcity means for Middle Eastern … food security. Agriculture will suffer because of climate change and water scarcity….”
In particular the World Bank asserts water scarcity caused by climate change will reduce farm production in Iran, Iraq, Jordan, Lebanon, Syria, and Turkey. The available evidence strongly suggests that will not happen.
Had the study’s authors examined real-world data concerning crop production in the Middle Eastern countries, they would have found, even amidst substantial strife in the region, crop yields and overall production have increased dramatically. More food is being produced even as thousands of acres of agricultural lands have been abandoned during regional conflicts.
Data from the U.N. Food and Agriculture Organization show during the period of modest warming since 1989:
- Cereal crop production in Iraq increased 91 percent, even as the acreage being harvested fell 5 percent.
- Cereal crop production in Iran increased 187 percent, while the acreage harvested increased by just 2.6 percent.
- Cereal Crop production in Jordan increased 15 percent, even as the acreage harvested declined 30 percent.
- Cereal Crop production in Lebanon increased 115 percent, while acreage harvested increased 30 percent.
- Cereal Crop production in Syria increased 22 percent, even as acreage harvested declined 66 percent.
- Cereal Crop production in Turkey increased 46 percent, even though acreage harvested declined 19 percent.
It is clearly good news – and not a climate crisis – that Middle Eastern countries have increased crop production despite the fact that many of them have been embroiled in internal political strife, outright civil warfare, and external conflicts. That good news is ignored in the World Bank’s doom-and-gloom report.
Global warming lengthens growing seasons, reduces frost events, and makes more land suitable for crop production. Also, carbon dioxide is an aerial fertilizer for plant life. In addition, crops also use water more efficiently under conditions of higher carbon dioxide, losing less water to transpiration. The latter fact should have allayed the World Bank’s concern about climate change induced water shortages leading to crop failure.
The benefits of more atmospheric carbon dioxide and a modestly warming world have resulted in 17 percent more food being available per person today than there was 30 years ago, even as the number of people has grown by billions. Indeed, the last 20 years have seen the largest decline in hunger, malnutrition, and starvation in human history.
Sorry, World Bank, Google, and PhysOrg, but that does not equate to a climate crisis.
H. Sterling Burnett, Ph.D. is managing editor of Environment & Climate News and a research fellow for environment and energy policy at The Heartland Institute. Burnett worked at the National Center for Policy Analysis for 18 years, most recently as a senior fellow in charge of NCPA’s environmental policy program. He has held various positions in professional and public policy organizations, including serving as a member of the Environment and Natural Resources Task Force in the Texas Comptroller’s e-Texas commission.
Was It Really The Wettest Day?
By Paul Homewood | Not A Lot Of People Know That | November 5, 2020
Saturday 3 October was the wettest day for UK-wide rainfall since records began in 1891, Met Office researchers have said.
The downpour followed in the wake of Storm Alex and saw an average of 31.7mm (1.24ins) of rain across the entire UK.
The deluge was enough to exceed the capacity of Loch Ness – the largest lake in the UK by volume – the researchers added.
The previous record wettest day was 29 August 1986.
No doubt this will be wheeled out at the end of the year by the Met Office to bolster its “extreme weather” propaganda. But was it really the wettest day? How do we know?
Quite simply, we don’t, because the Met Office have never published a database of UK daily rainfall. Instead we are expected to take their word for it. Would you trust a company claiming that it had just made record profits, when it had never published any accounts? Of course not.
We also know that the Met Office has recently included several high altitude sites in its rainfall database, which have inevitably skewed upwards rainfall totals.
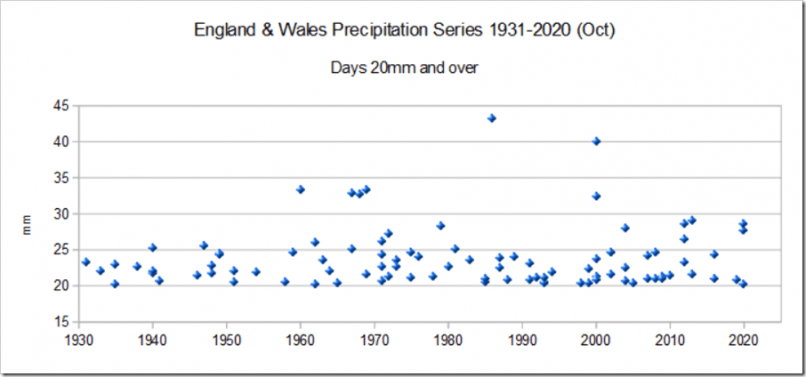
However, although they do not publish UK daily rainfall data, we do have daily data from the England & Wales Precipitation Series back to 1931. This series categorically shows that October 3rd was not a record, nor anywhere close.
Rainfall totalled 28.48mm on that day, well below the record of 43.23mm which fell in August 1986. Last month’s “record” was in fact only the tenth wettest day.
https://www.metoffice.gov.uk/hadobs/hadukp/data/daily/HadEWP_daily_qc.txt
Even the England & Wales series is of limited value, as it still only has 90 years of data. There will undoubtedly have been many other extremely wet days earlier.
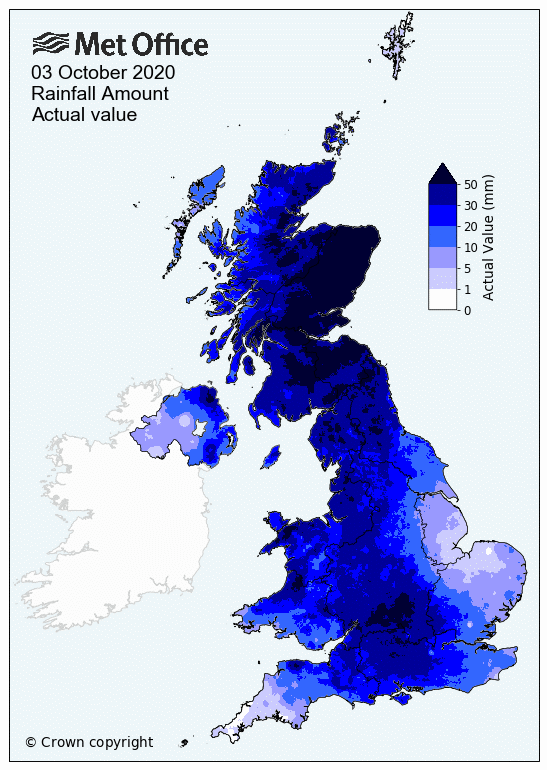
In fact, as the Met Office admits, the rainfall on 3rd October was not particularly intense anywhere, simply widespread across the whole country.
For instance, Oxfordshire was one of the wettest spots in England, and they had about 60mm that day:
https://blog.metoffice.gov.uk/2020/10/16/rainfall-on-uks-wettest-day-on-record-could-have-more-than-filled-loch-ness/
However, even at Oxford, such a total was far from being unprecedented:
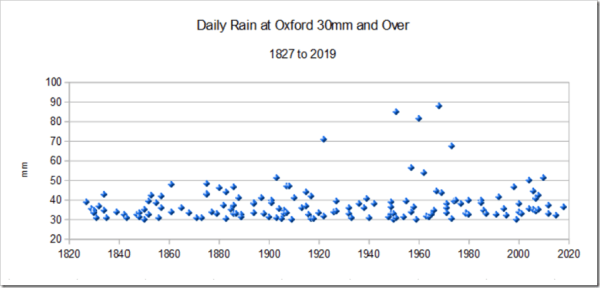
https://notalotofpeopleknowthat.wordpress.com/2020/11/03/bbcs-oxford-soggy-month-claims-undermined-by-the-actual-data/
To be fair, Scotland got a real drenching that day, which may have tilted the UK figures up from the England & Wales ones. However, as I have frequently pointed out, Scotland has become wetter in recent decades, but that does not mean that the rest of the UK has.
The Met Office’s Mark McCarthy gives us the usual weasel words:
“We can’t make any definitive statements specifically about the attribution of this particular event on October 3,” said Dr McCarthy.
“There’s a general expectation that under our warming climate, we would expect to see increases in some types of extreme rainfall and rainfall events and we’re expecting to have wetter winters overall, we could expect increases in these types of extremes.”
If what he says is true, we would expect to see a pattern of increasingly extreme wet weather in England & Wales, and not just Scotland. The fact is that there is no such pattern, either in these intense daily events, or for that matter monthly totals.
Clearly therefore his theory holds no water.
Global Cooling will kill us all!
By Andy May | Watts Up With That? | November 5, 2020
As Angus McFarlane shows in a 2018 well researched wattsupwiththat.com web post (McFarlane, 2018), some 65% of the peer-reviewed climate papers, that offered an opinion, published between 1965 and 1979 predicted that the global cooling seen at the time would continue. He references and is supported by a Notrickszone post by Kenneth Richard (Richard, 2016).
Attempts to erase the “global cooling scare” from the internet by the notorious William Connolley, who has rewritten 5,428 Wikipedia articles in a vain attempt to change history, failed. As James Delingpole explains in The Telegraph, Connolley systematically turned Wikipedia into a man-made global warming advocacy machine (Delingpole, 2009). He rewrote articles on global warming, the greenhouse effect, climate models and on global cooling. He tried to erase the Medieval Warm Period and the Little Ice Age. In the Wikipedia pages he trashed famous climate scientists who were skeptical of man-made global warming like Richard Lindzen, Fred Singer, Willie Soon and Sallie Baliunas. He also blocked people from correcting his lies.
William Connolley is friends with Michael Mann and his Hockey Team, which includes Phil Jones and Raymond Bradley. He is also a cofounder of the alarmist website Realclimate.org. Obviously, Connolley made sure that Mann and Bradley received glowing praise on Wikipedia until he was fired in 2009 and removed as a Wikipedia administrator (Delingpole, 2009).
We are not surprised that Connolley shows up as a co-author on the peer-reviewed paper, “The Myth of the 1970s Global Cooling Scientific Consensus” in BAMS, written by Thomas Peterson, William Connolley and John Fleck (Peterson, Connolley, & Fleck, 2008). The paper is nonsense and made no difference because facts are stubborn things. That the paper passed peer-review illustrates how corrupt climate science has become. The paper begins with this:
“There was no scientific consensus in the 1970s that the Earth was headed into an imminent ice age. Indeed, the possibility of anthropogenic warming dominated the peer-reviewed literature even then.” (Peterson, Connolley, & Fleck, 2008)

Figure 1. The U.K. Met Office Hadley Centre and the Climatic Research Unit (CRU) at the University of East Anglia global average temperature reconstruction since 1850. It shows, like other reconstructions, global cooling of about 0.09°C (0.16°F) from 1944 to 1977.
The global cooling scare of the 1960s and 1970s did exist, both climate scientists and the public were afraid that the global cooling trend, that began in the 1940s (see Figure 1), would continue and the world would turn very cold, maybe even return to a glacial period like the one that ended about 11,700 years ago at the beginning of the Holocene Epoch.
The Peterson, et al. paper carefully cherry picks 71 papers and claims that only seven papers between 1965 and 1979 disagreed with the “consensus” position that global warming would occur in the future. They found 20 that took a neutral position and 44 that agreed with the global warming consensus. But the world was cooling then and had been since 1944. Kenneth Richard researched this and expanded the time frame to 1960 to 1989. Richard found 285 papers that disagreed with the “consensus” position that global warming would occur in the future (Richard, 2016).
Of these 285 papers, 156 discussed the cooling since 1940 and predicted future cooling. Seven tried to show that CO2 might be causing the cooling. A complete list of papers can be downloaded from Kenneth Richard’s post. The alarmists fudged the numbers to show a 97% consensus that man caused global warming, then they fudged the global cooling consensus in the same way.
Angus McFarlane took the databases created by Kenneth Richard and Peterson, et al., merged them (there were 16 duplicates) and then did an independent search of his own. He found two additional relevant papers that were not already in one of the two databases. Then he eliminated the papers that were outside the original Peterson et al. period of 1965-1979.
McFarlane’s database is smaller than Richard’s and only has 190 relevant papers, but this is 119 more than Peterson, et al. found and it covers the same period. McFarlane’s review of the papers found that 86 predicted future cooling, 58 were neutral, and 46 predicted warming. Of the 86 cooling papers, 30 predicted a possible new “ice age.” Strictly speaking, we are in an ice age, what they mean is a new glacial period where ice advances to a major new maximum extent like 19,000 years ago in the last major glacial maximum. The 86 cooling papers are 45% of the total. If we ignore the neutral papers, like John Cook, et al. did (Cook, et al., 2013) in his 97% consensus study, then cooling papers are 65% of the papers that offered an opinion. Using Cook’s rules, we can comfortably claim there was a global cooling consensus in 1979.
However, once the mid-twentieth century cooling trend reversed and became a warming trend, it did not take long for the “consensus” to reverse as well. The global surface temperature trend changed to warming (about 0.017°C/year as shown in the graph) around 1977, and the peer-reviewed climate papers from 1977-1979 changed to a ratio of 52% warming to 48% cooling, a bare majority of warming papers, ignoring the neutral papers. During the 1980s the papers quickly changed to pro-warming.
The press in the mid-seventies reported that a consensus of climate scientists believed the world was cooling and the cooling would continue (Struck, 2014). Articles on the cooling consensus appeared in Newsweek, Time, the New York Times, and National Geographic. A landmark story by Peter Gwynne in Newsweek April 28, 1975 was typical (Gwynne, 1975). It was entitled “The Cooling World.” In the overheated style of Newsweek, the article begins, “There are ominous signs that the earth’s weather patterns have begun to change dramatically.” Later in the article Gwynne breathlessly explains “… the earth’s climate seems to be cooling down. … and the resulting famines could be catastrophic.” Gwynne’s cited sources include the National Academy of Sciences, Murray Mitchell (NOAA), George Kukla (Columbia University), James McQuigg (NOAA’s Center for Climatic and Environmental Assessment) (Gwynne, 1975).
George Kukla of Columbia University and the Lamont-Doherty Earth Observatory did not change his view of a long-term global cooling trend, like many of his colleagues did. When he sadly passed away May 31, 2014, he still believed that a new massive glacial period would begin in the future, perhaps 5,000 years from now. Javier Vinós, in his blog post on “The next glaciation,” (Vinós, 2018) predicts that the next major glaciation will begin in 1500 to 2500 years. It is fortunate that both predictions are far in the future.
When the next global cooling period begins, as it inevitably will, will climate scientists write more global cooling papers? Why should we believe climate scientists who say the world is warming dangerously now, when just 50 or 60 years ago they were saying it was dangerously cooling? A reasonable question. What direct evidence has arisen that convinced them to reverse course? We had a consensus for cooling when the world was cooling, now we have a consensus for warming and the world is warming. Is that all there is to it? Both are hypotheses, what makes them become facts or theories?
Hypotheses are speculative ideas. A real scientist asks, “Is that so? Tell me why you think that.” A rigorous scientific process must be used to demonstrate why observed events, such as global warming or global cooling, are occurring. To show they are potentially dangerous takes even more work.
Consensus is a political thing. The public forms a consensus opinion, then vote and make laws or rules that reflect the opinion. In science, we first form a hypothesis or idea that explains an observed natural phenomenon, such as warming or cooling. The next step is to attempt to disprove it. If we fail the idea survives. We publish what we did, and others attempt to disprove the idea, if they fail to disprove it, it survives. Once this has gone on long enough, the idea becomes a theory. A scientific theory simply survives, it is never proven, it must always be subject to testing.
We mentioned above that seven of the papers examined by Angus McFarlane and Kenneth Richard suggested that CO2 might be causing global cooling. A good example is Sherwood Idso’s, 1984 paper in the Journal of Climatology. The paper is entitled “What if Increases in Atmospheric CO2 Have an inverse Greenhouse Effect?” (Idso, 1984). Idso speculates that additional CO2 will encourage plants to move into more arid areas, because additional CO2 causes plants to use less water per pound of growth. Idso thinks that this might change Earth’s albedo (reflectivity) in such a way as to lower temperatures. In a similar way, Richard Lindzen and Yong-Sang Choi speculated that additional CO2 would increase humidity in the tropics and thus cloud cover (Lindzen & Choi, 2011). Extremely small changes in average cloud cover can have a large cooling effect during the daytime.
Peter Webster presents an interesting discussion of Sherwood Idso’s work in his Climatic Change paper, “The Carbon Dioxide/Climate Controversy: Some Personal Comments on Two Recent Publications” (Webster, 1984). Besides an interesting discussion of the emotions involved in the human-caused climate change debate, we can see from Webster’s discussion, and Idso’s paper, how little we really know about the impact of additional CO2 in the real world. Tiny changes in Earth’s albedo, whether due to cloud cover or the distribution of plants can make a huge difference.
Empirical estimates of ECS (the change in air temperature due to doubling the CO2 concentration) have never matched theoretical calculations from climate models. The empirical values (like Idso’s or Lindzen and Choi’s) are normally about half of model estimates, and can be negative, like Idso’s. This is likely because the models are missing something and possible future changes in albedo due to changing cloud and plant cover are likely candidates.
This post is condensed and modified from my new book, Politics and Climate Change: A History.
To download the post bibliography click here.
Featured Video

New positive ivermectin evidence
or go to
Aletho News Archives – Video-Images
From the Archives
Fanatical Followers of the Covid Regime: A Jim Jones-Style Cult?
By Professor Roger Watson and Dr. Niall McCrae | The Daily Sceptic | November 15, 2021
As scholars at leading British universities over recent decades, we witnessed the replacement of critical thinking and debate by narrative: facts are discrimination and scientific method is imperialism; truth, instead, is derived from ‘progressive’ values. This educational trend may be a major contributory factor to the ease in which society has been inculcated to the Covid ‘new normal’ of masking, testing, and repeated doses of vaccines for a disease of similar risk to severe influenza.
One doesn’t need much critical reasoning to observe the flawed logic of some vaccination enthusiasts, such as people who respond to experiencing any side effects, however debilitating, by saying “at least I know it’s working”, or, after contracting the disease despite their promised inoculation (over 90% effective, according to initial drug company claims), “I’d have been worse off without the jab.” … continue
Blog Roll
 Aletho News
- EU Council Advances Chat Control 2.0 Scanning Proposal
- Ex-Greek MEP files complaint against Israeli spyware firm over alleged Pegasus surveillance
- Troubling ideas throughout the Torah, Talmud, Mishneh Torah and Tanya
- ‘Grave, alarming’: Iran mission on Trump’s UNGA ‘annihilation’ threats
- Najaf airport to reopen to Iranian flights within 24 hours: Ambassador
- From ‘How Will This End For Iran’ to ‘When America Walks Away’: A tale of two Economist covers
- Tehran blasts ‘baseless’ speculation linking Iran to alleged bomb plot at UK air base
- The Rise And… Rise Of ‘Color Revolutions’
- The Coming GOP Bloodbath?
- Arctic Scare Stories Melt Away
- If Americans Knew
- Netanyahu Asked UAE Leader to Deny Report on Oct. 7 Warning in Secret Visit, Sources Say
- CNN Chief Int’l Correspondent Clarissa Ward on Journalists in Gaza
- Democratic Party Consultants Surround Troy Jackson with Pro-Israel Donors
- Christian Leader Responds To Netanyahu’s Claims Regarding Palestinian Christians
- In Gaza, ‘Whoever Survives the Bombing Won’t Survive the Rubble’
- Israel kills more Palestinians, amid push to resettle Gaza – Daily Update
- Israel forces Gazans to live in constant peril – Daily Update
- Deconstructing Netanyahu’s pants-on-fire UN rant – Daily Update
- Trump betrayed voters with his campaign lies and prioritized a foreign country once he took office
- Netanyahu calls Israel’s war in Gaza ‘opposite of genocide’ in UN speech to near-empty hall
- No Tricks Zone
- New Study: Earth And Venus Surface Warmth Largely Explained By Convection And Lapse Rate, Not CO2 Or Radiation
- 2025 Nature Paper Claiming Worsening Global Drought Gets RETRACTED …Heavily Flawed
- New Study: ‘Global Drought Shows No Detectable Recent Acceleration Under Climate Warming’
- Economic Masterminds: German Socialists Suggest Taxing Productivity Gains Stemming From Using AI
- The South China Sea Has Not Been Cooperating With The Climate Change Narrative
- Energy Crisis: Germany Enters Heating Season With Historically Low Gas Reserve Fill Levels
- New Study: The Antarctic Ice Sheet Gained Mass From 2020-2024 Due To Staggering Snow And Ice Accumulation
- Study: Ocean Heating Rates From Thousands Of Years Ago ‘Dwarf’ Modern Ocean Heating Rates
- Climate Extremists Target, Attack Large-Scale Power Grid Infrastructure In Germany!
- New Study: Antarctic Ice Melt Has Contributed Less Than 1 Centimeter To Sea Level Rise In The Last 30 Years


